Goal Tracking
Giving large advisory firms a single, trusted view of performance against their goals.
Launched on
Visit →
Overview
Northwestern Mutual’s Goals feature lets advisors set and track business goals — revenue, sales, activity, and priority goals. But the experience was built for the individual advisor. It doesn’t fit how large firms actually operate: complex team structures, entity advisors, and shared production. Only contracted FRs can set goals, so much of a firm is left out.
To compensate, most large firms run goal tracking out of spreadsheets — manually entering firm-level and advisor-level goals, then spending significant hours every week maintaining the data. As Lead Product Designer in the Practice Management product area, I led design strategy for a new goals experience that gives large teams a centralized, transparent, and actionable view of their performance.
The work ladders up to NM’s multi-year strategy around Trusted Advisors and the company’s focus on growing our impact by accelerating field growth.
Approach
This was an Inform-phase effort: understand how large firms set and track goals today before committing to a direction. I partnered with a cross-functional team across UX research, design, product, practice management, and engineering — building a shared understanding from existing research, conversations with top large firms, and the firms’ own tools and workflows.
AI tools accelerated every phase of this work. Microsoft Copilot synthesized research transcripts into structured insights and How Might We statements. Claude supported design strategy analysis and structured thinking across the initiative. Figma Make generated medium-fidelity wireframes from structured prompts in the Sketch phase. VS Code was used to build the coded prototype for research testing — compressing what typically spans weeks of iteration into a single, continuous sprint.
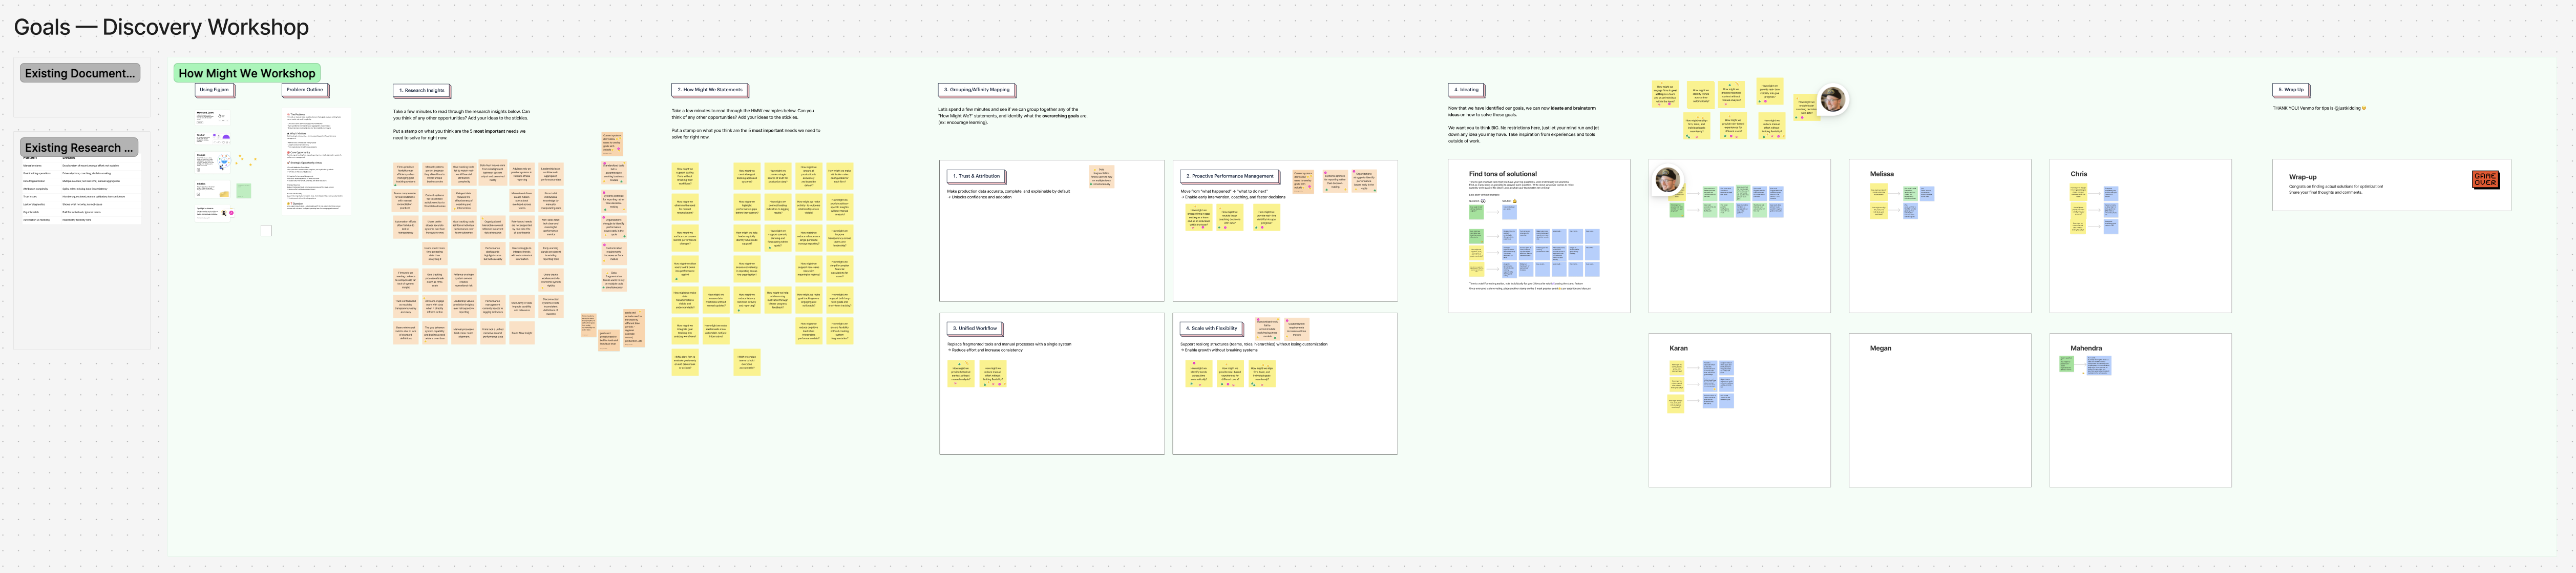
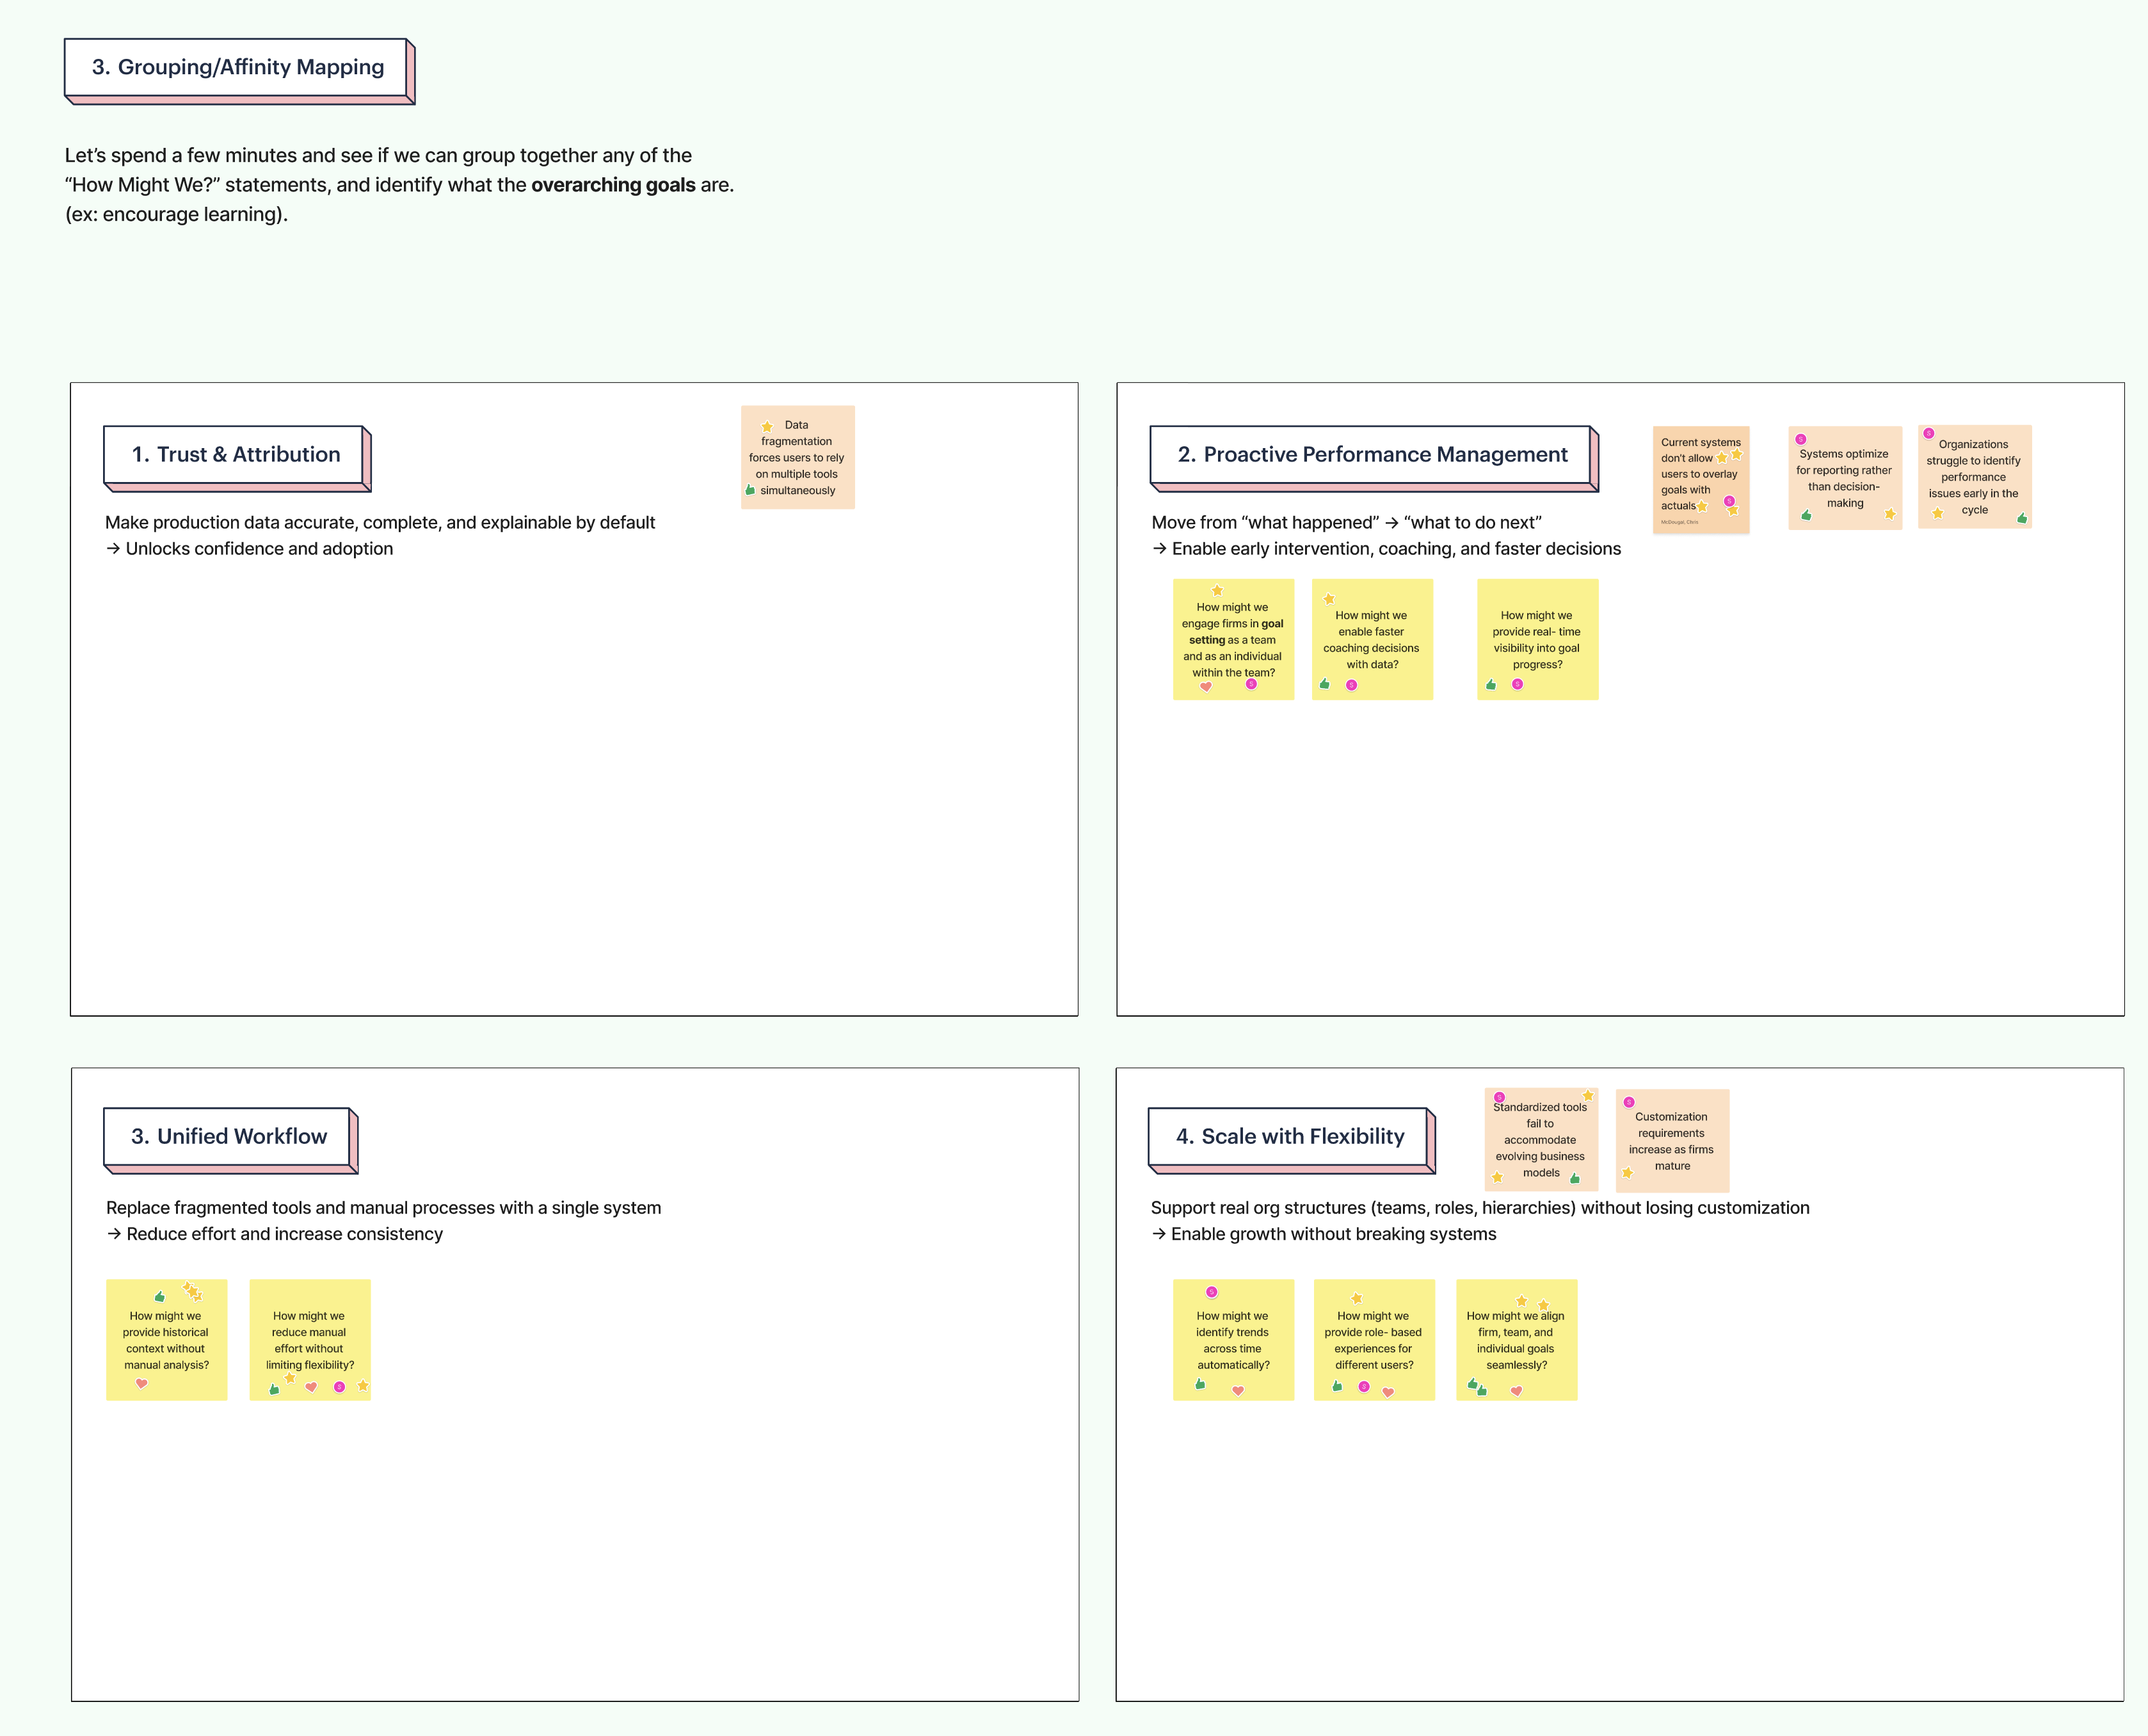
We ran a structured discovery workshop to move from raw research into shared opportunities: review insights, write How Might We statements, cluster them, then ideate against the strongest ones.
Define
The research showed that goal tracking isn’t a reporting task for these firms — it’s an operating system. Firms run on a weekly rhythm: scorecard and leader meetings review performance, while leading indicators (referrals, fact finders, appointments, closes) are tracked daily. Lagging metrics like GDC, FYC, and AUM growth are reviewed periodically, with most firms targeting roughly 10–20% annual growth.
The UX research team ran moderated 1:1 remote interviews with operations leaders — COOs and CFOs — at top large firms. Sessions were recorded and transcribed. Rather than manually coding hours of recordings, I fed the transcripts into Microsoft Copilot, prompting it to identify recurring themes, surface tensions, and extract verbatim evidence. Copilot’s synthesis gave the team a structured view of the data in a fraction of the time, which I then reviewed, pressure-tested against my own session observations, and used to generate the How Might We statements that framed the workshop.
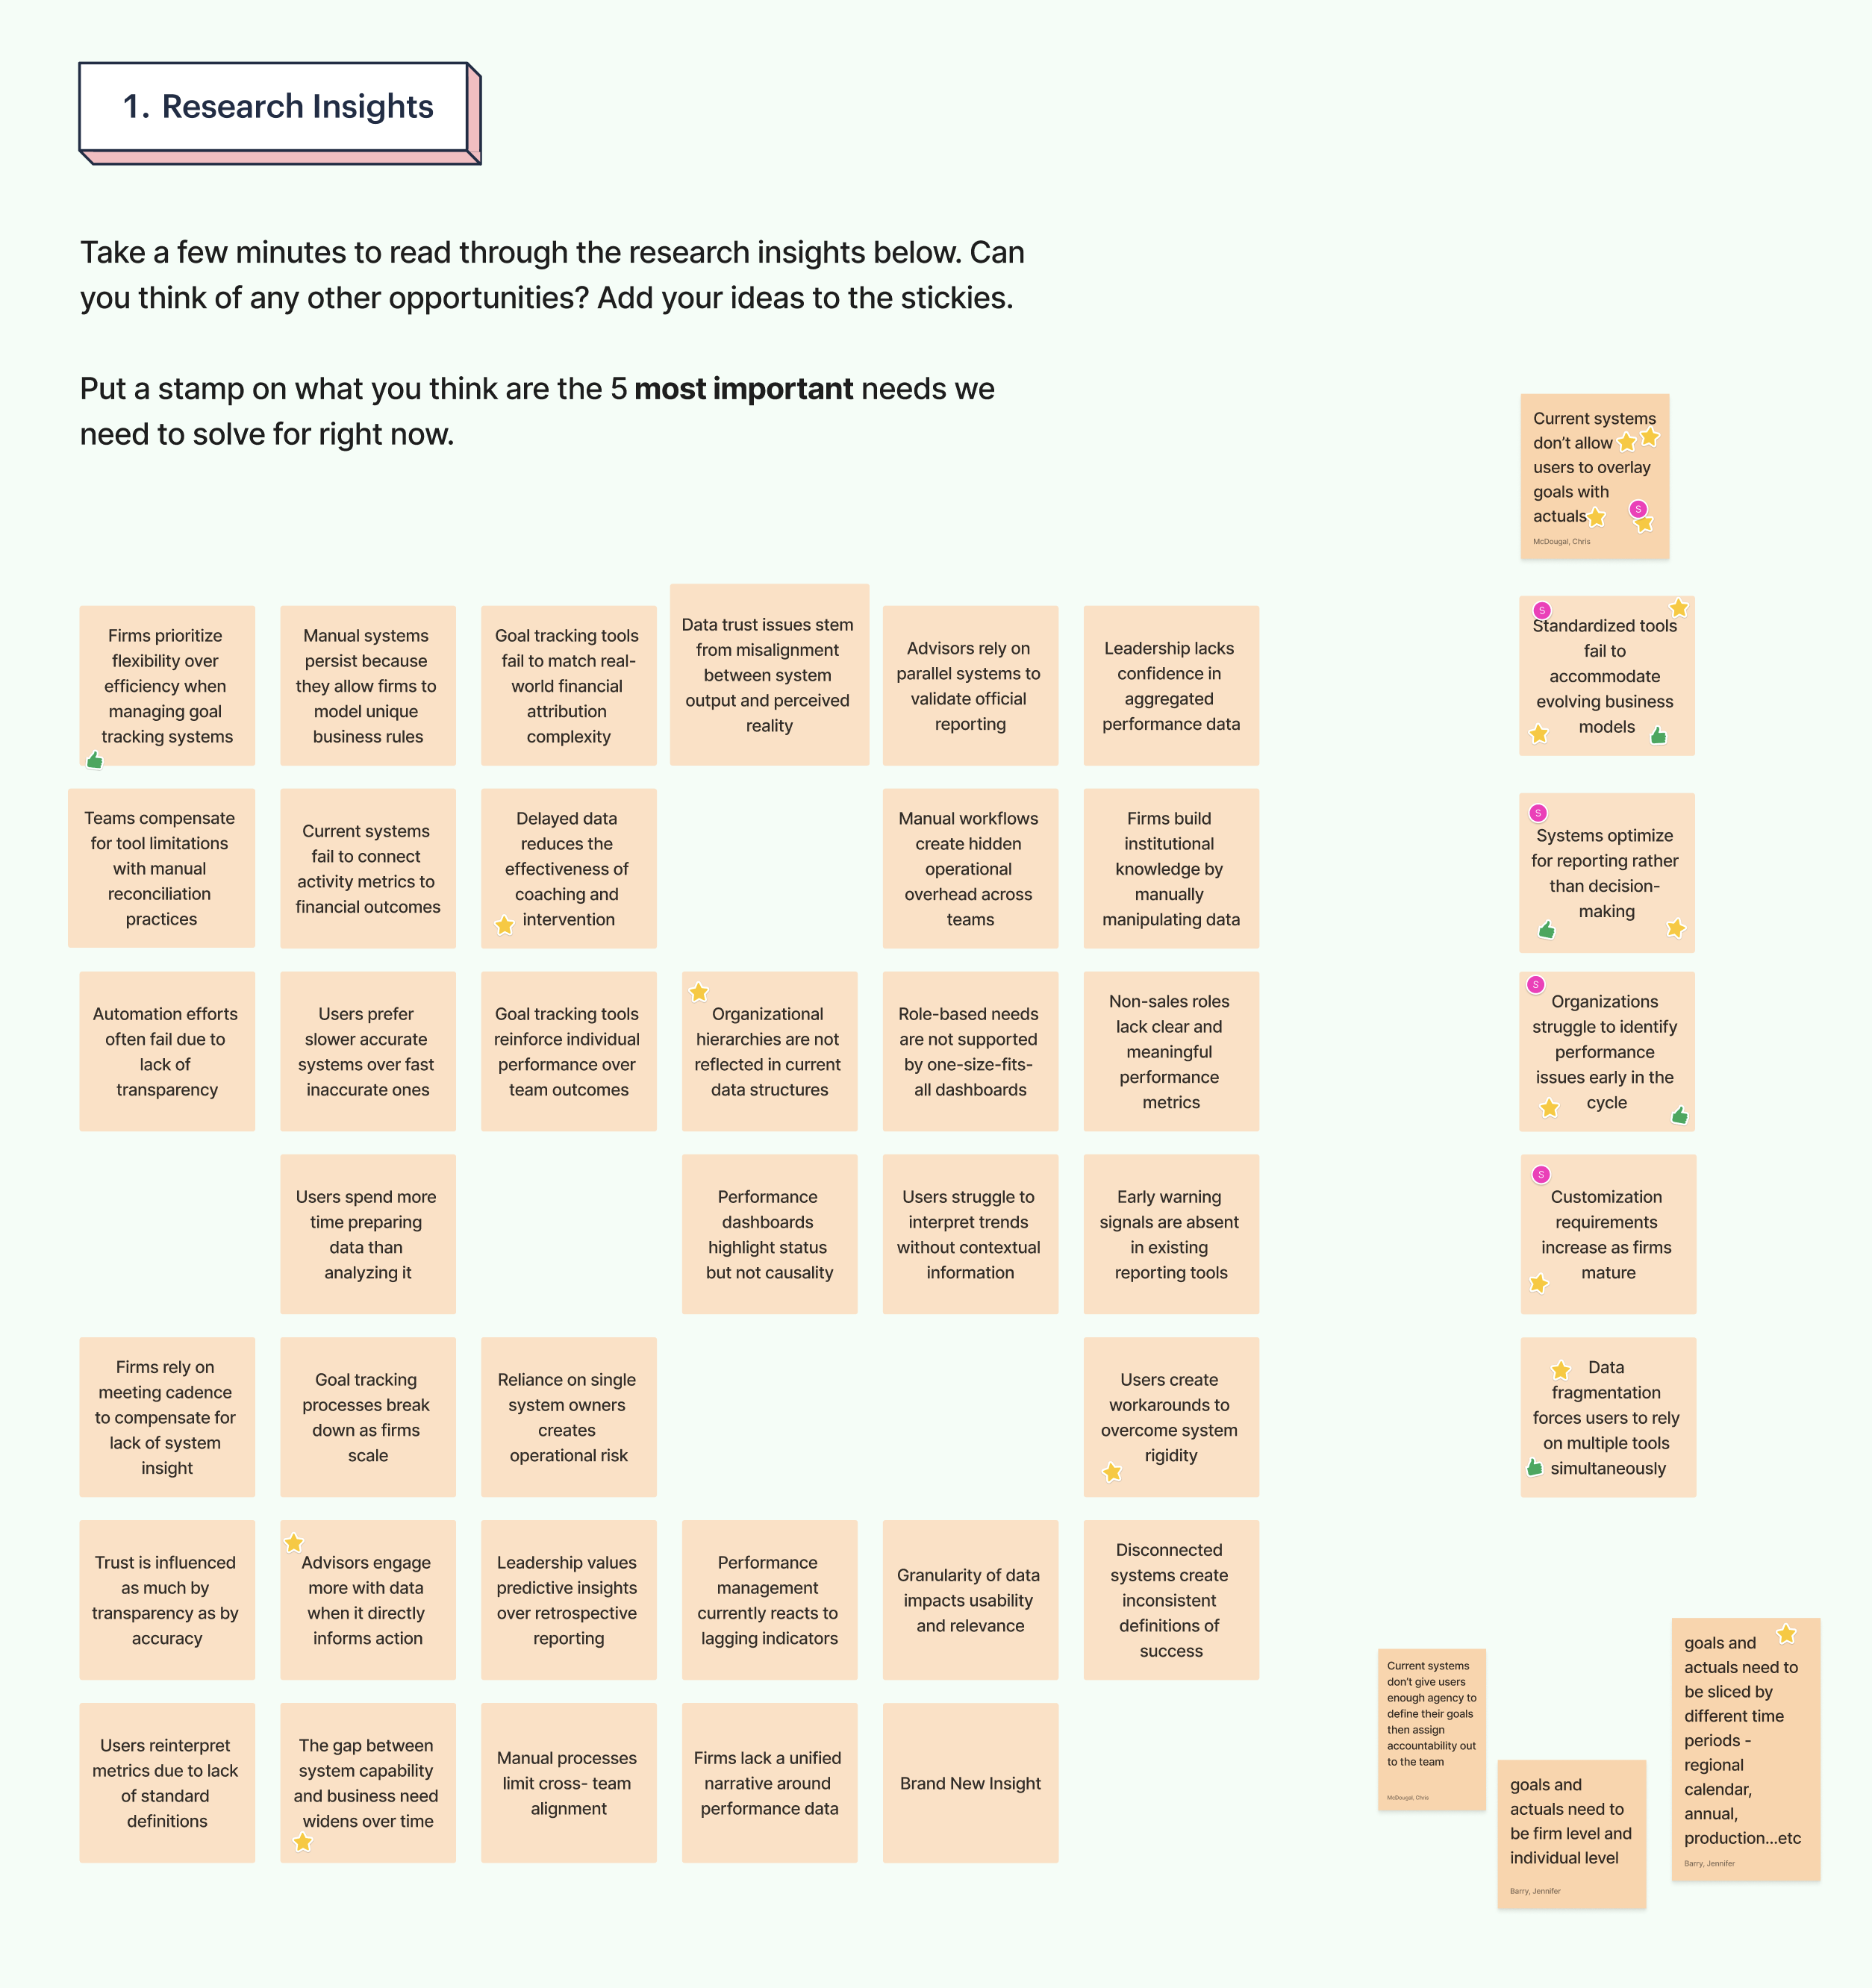
A few insights cut across every firm:
- Trust breaks when attribution is unclear. Splits, non-contracted roles, and household ambiguity make it hard to credit production correctly — and once people doubt the numbers, they stop using the system.
- Manual systems persist because they create understanding, not efficiency. The spreadsheet is painful, but firms trust it because they built it.
- Activity is disconnected from outcomes. Advisors struggle to connect what they do each week (meetings, prospecting) to what shows up later (revenue, AUM).
- Decisions need weekly signals, but the data arrives monthly. Aggregating across CRM, Book of Business, and spreadsheets introduces latency that makes early intervention nearly impossible.
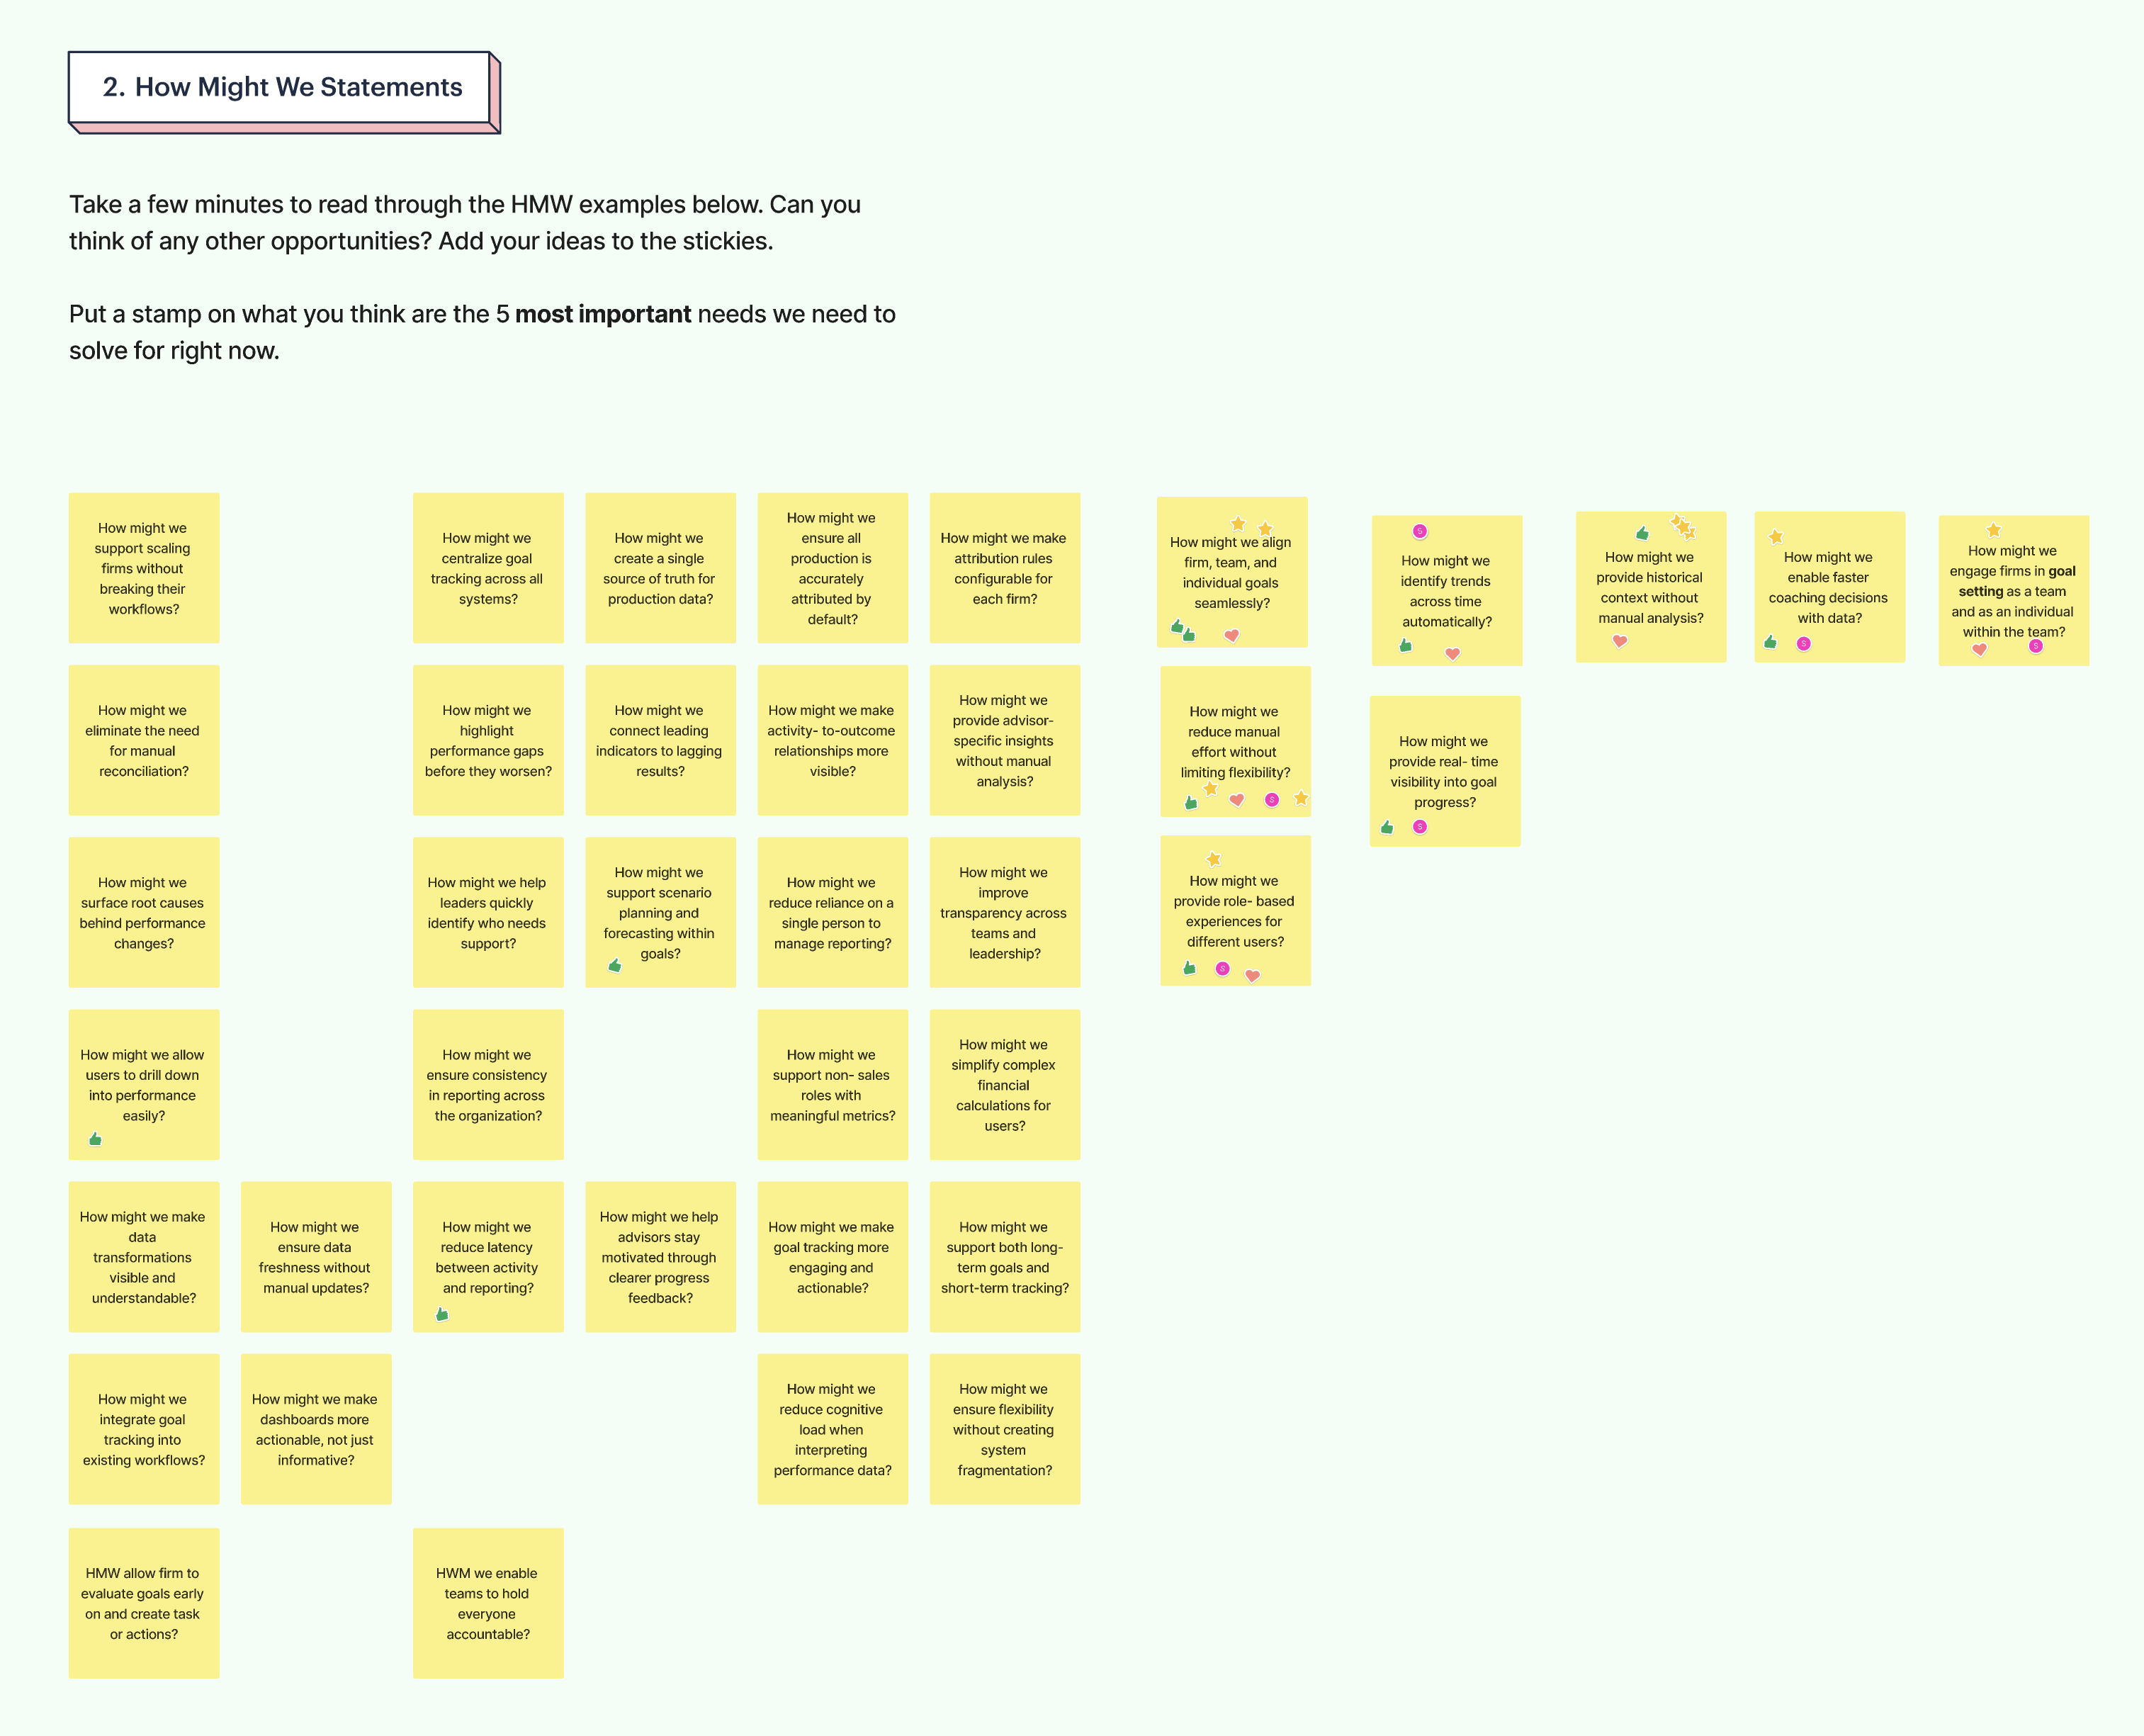
I reframed these into How Might We statements to open up the solution space.
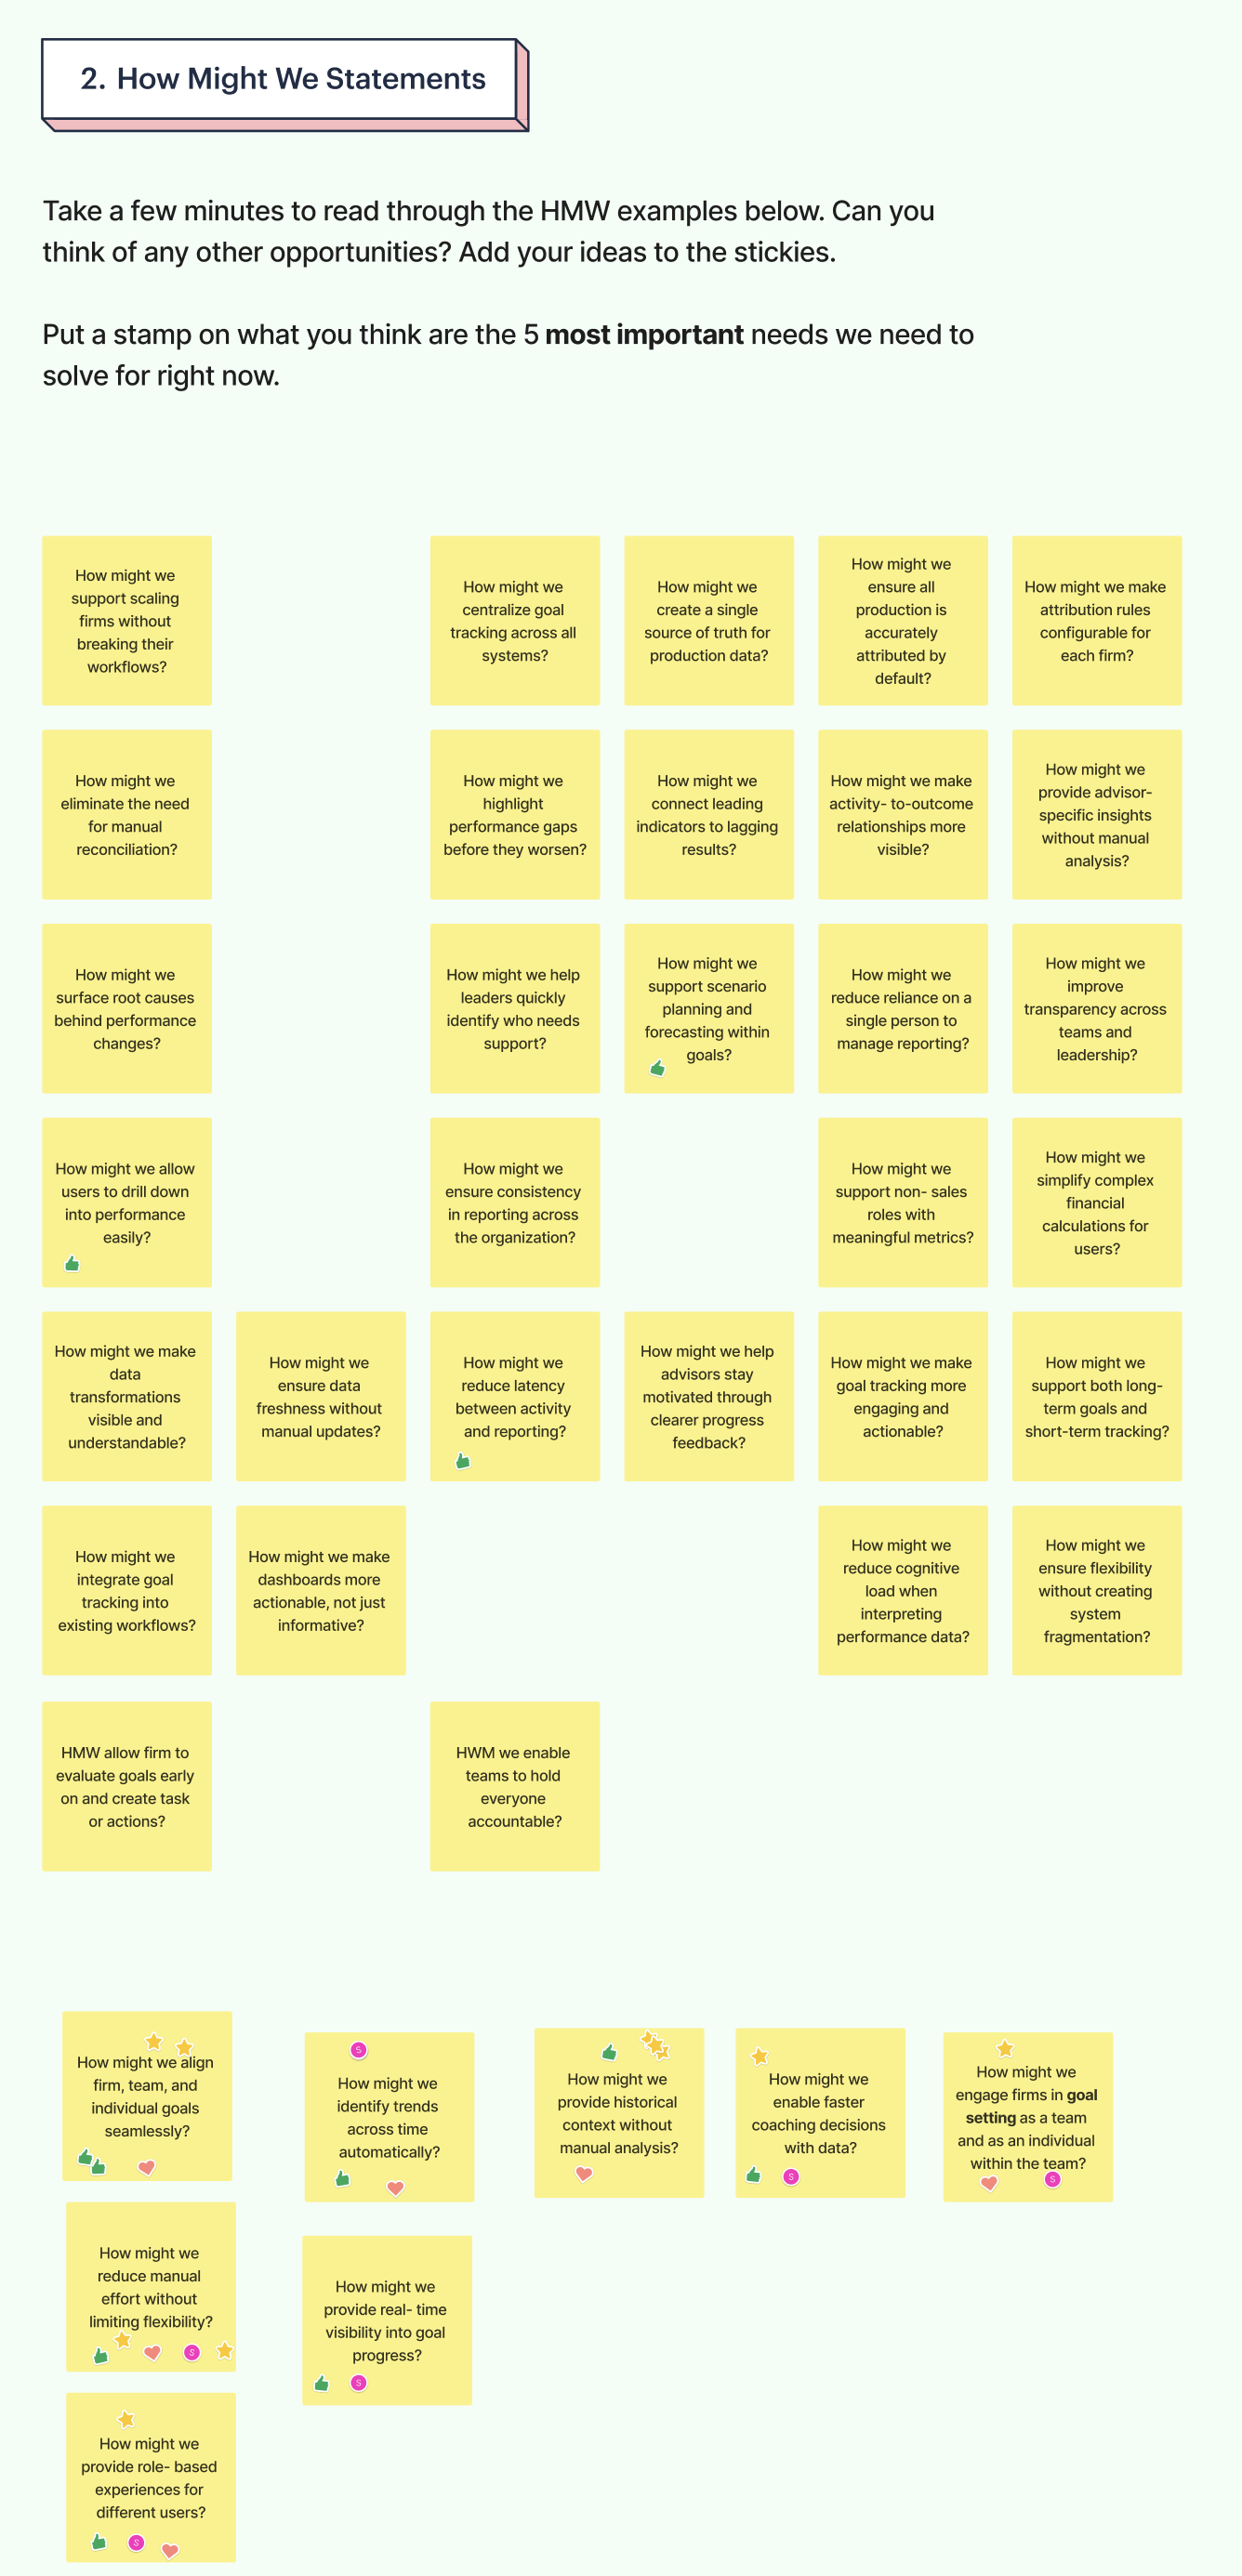
Clustering the HMWs surfaced four design pillars that anchored the rest of the work:
- Trust & Attribution — make production data accurate, complete, and explainable by default.
- Proactive Performance Management — move from “what happened” to “what to do next,” enabling early intervention and faster coaching.
- Unified Workflow — replace fragmented tools and manual processes with a single system.
- Scale with Flexibility — support real org structures (teams, roles, hierarchies) without losing firm-specific customization.
Sketch
With the pillars set, the team ideated widely before converging — generating directions for top-down goal setting (leaders cascade goals to teams), bottom-up goal ownership, firm-vs-team gap visibility, role-based views, AI-assisted goal suggestions based on history and growth targets, and embedded goal tracking across the product.
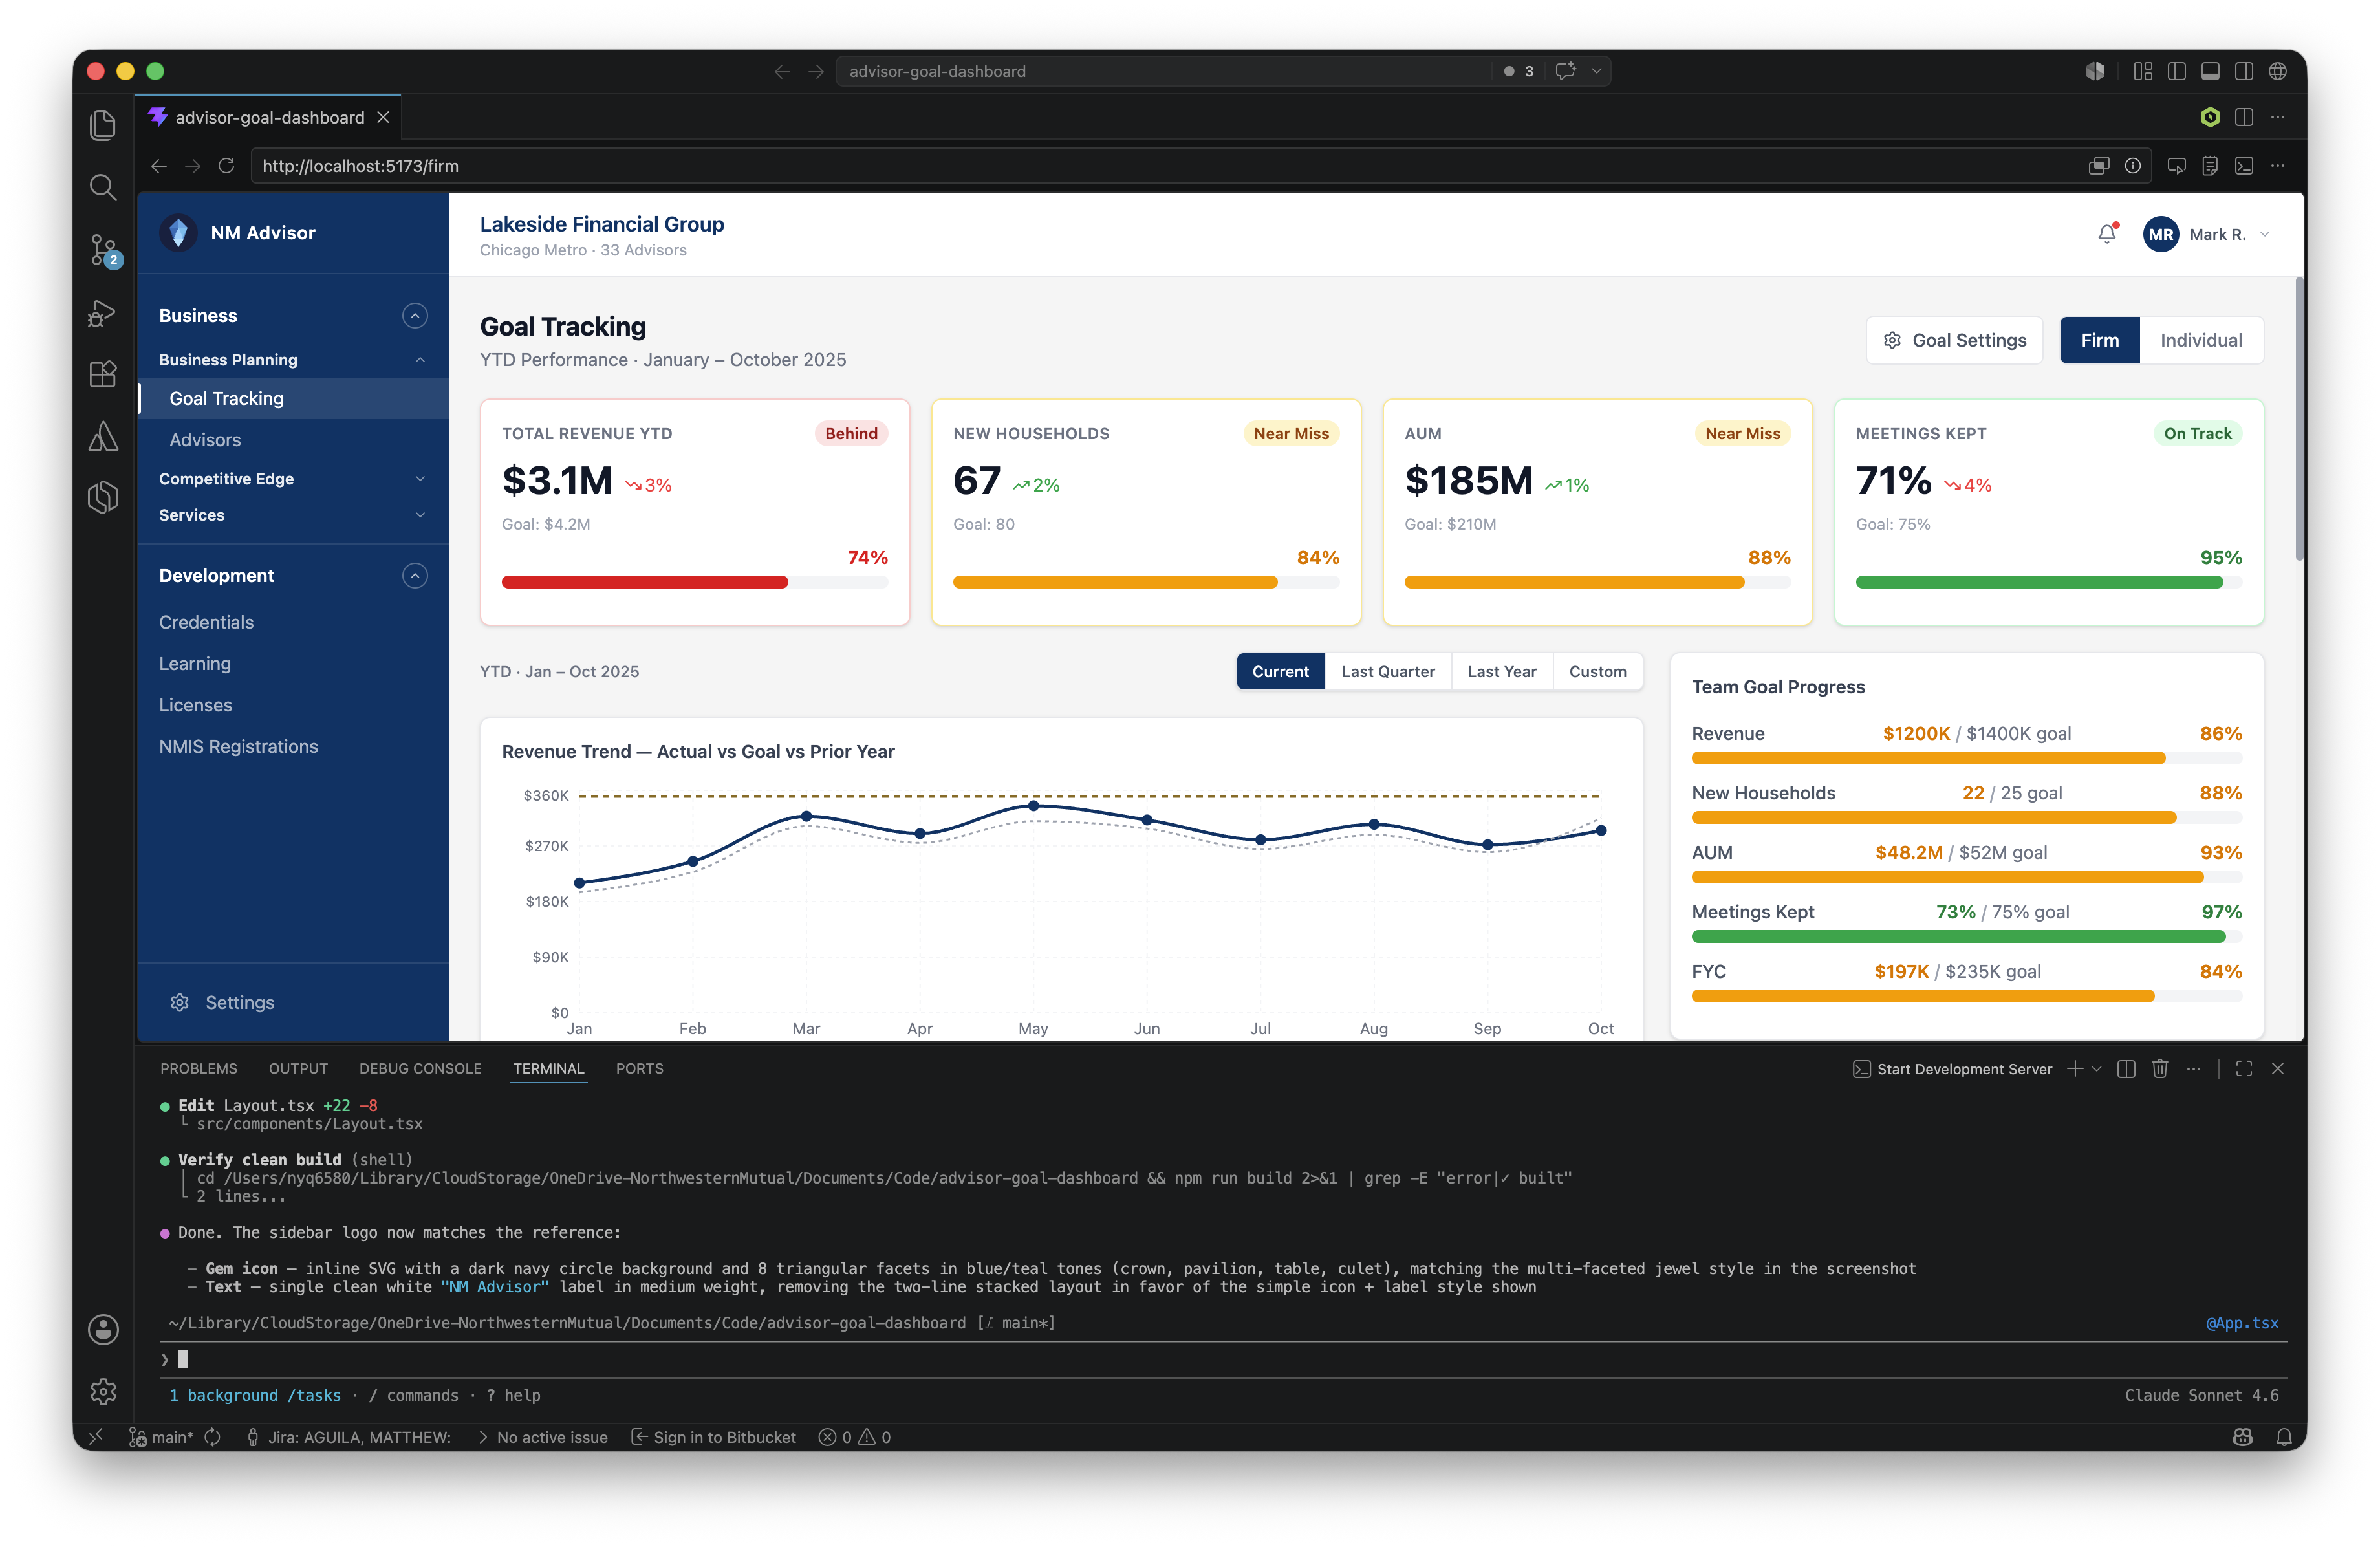
To move fast from strategy to something testable, I used Figma Make with a structured, metric-grounded prompt to generate medium-fidelity wireframes for the core views — onboarding, firm, team, and individual dashboards. Because the prompt carried real workflows and ratios from the research, the output was immediately reviewable against how firms actually work.
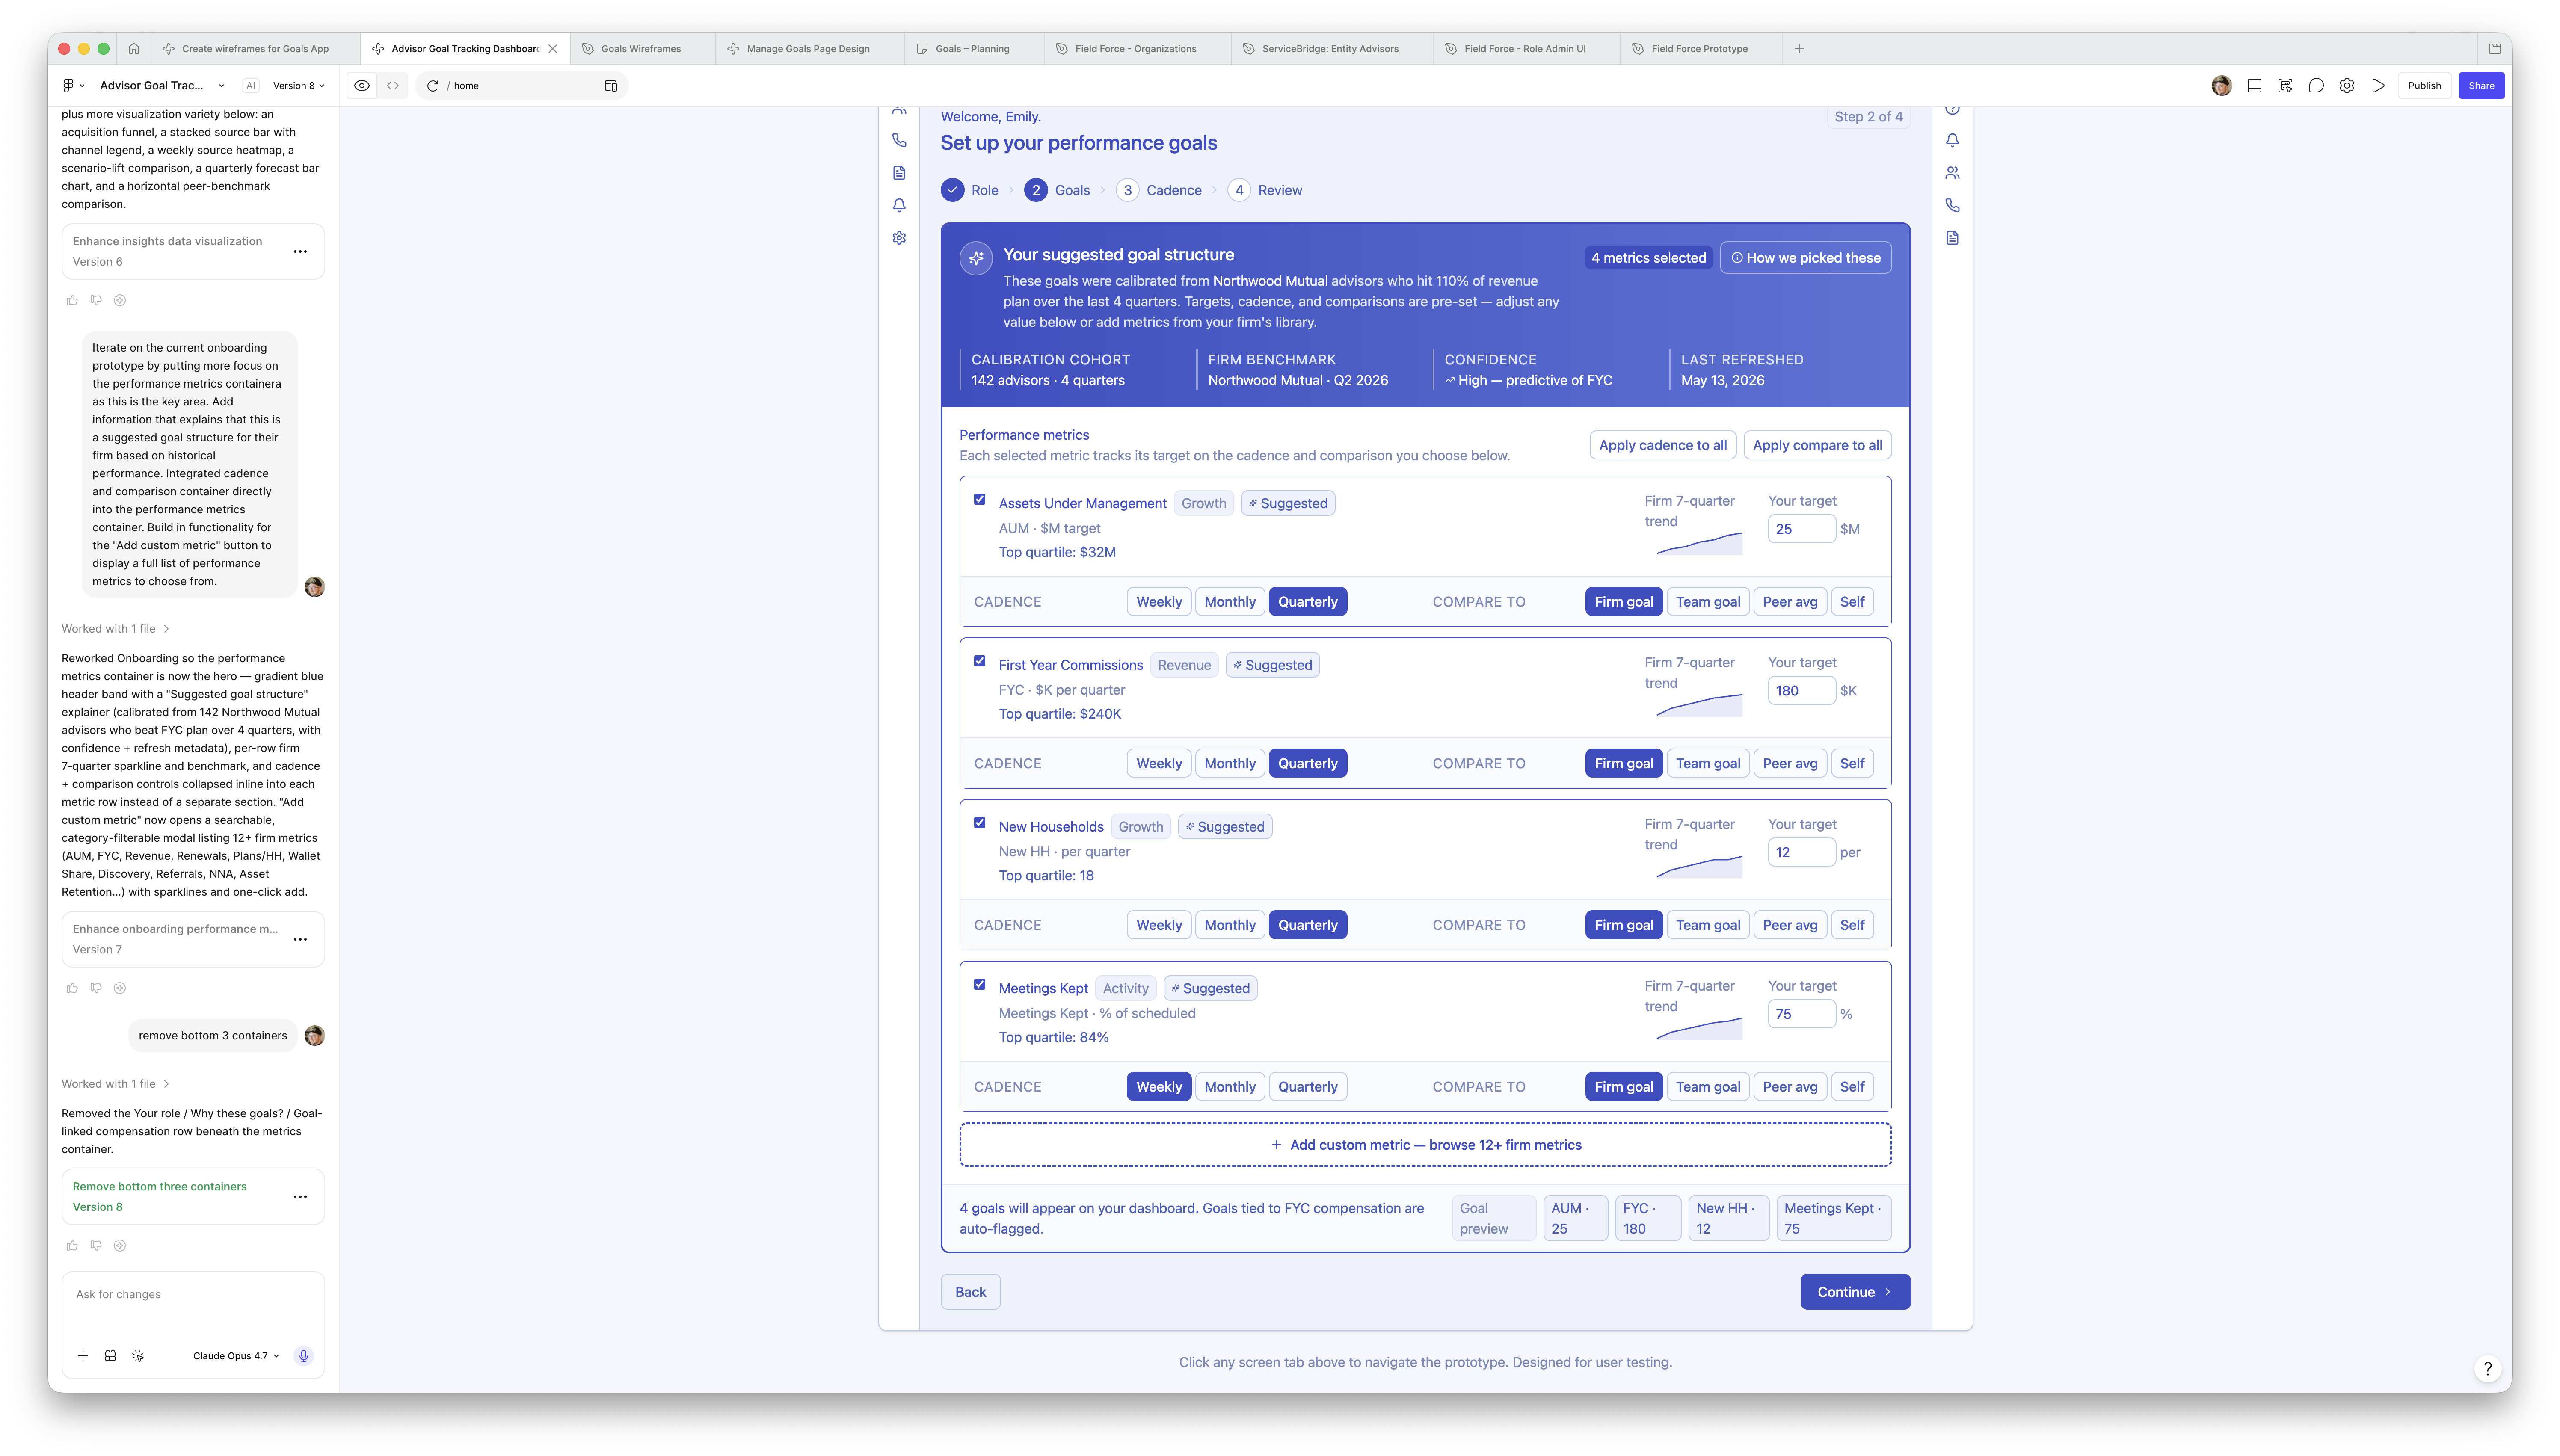
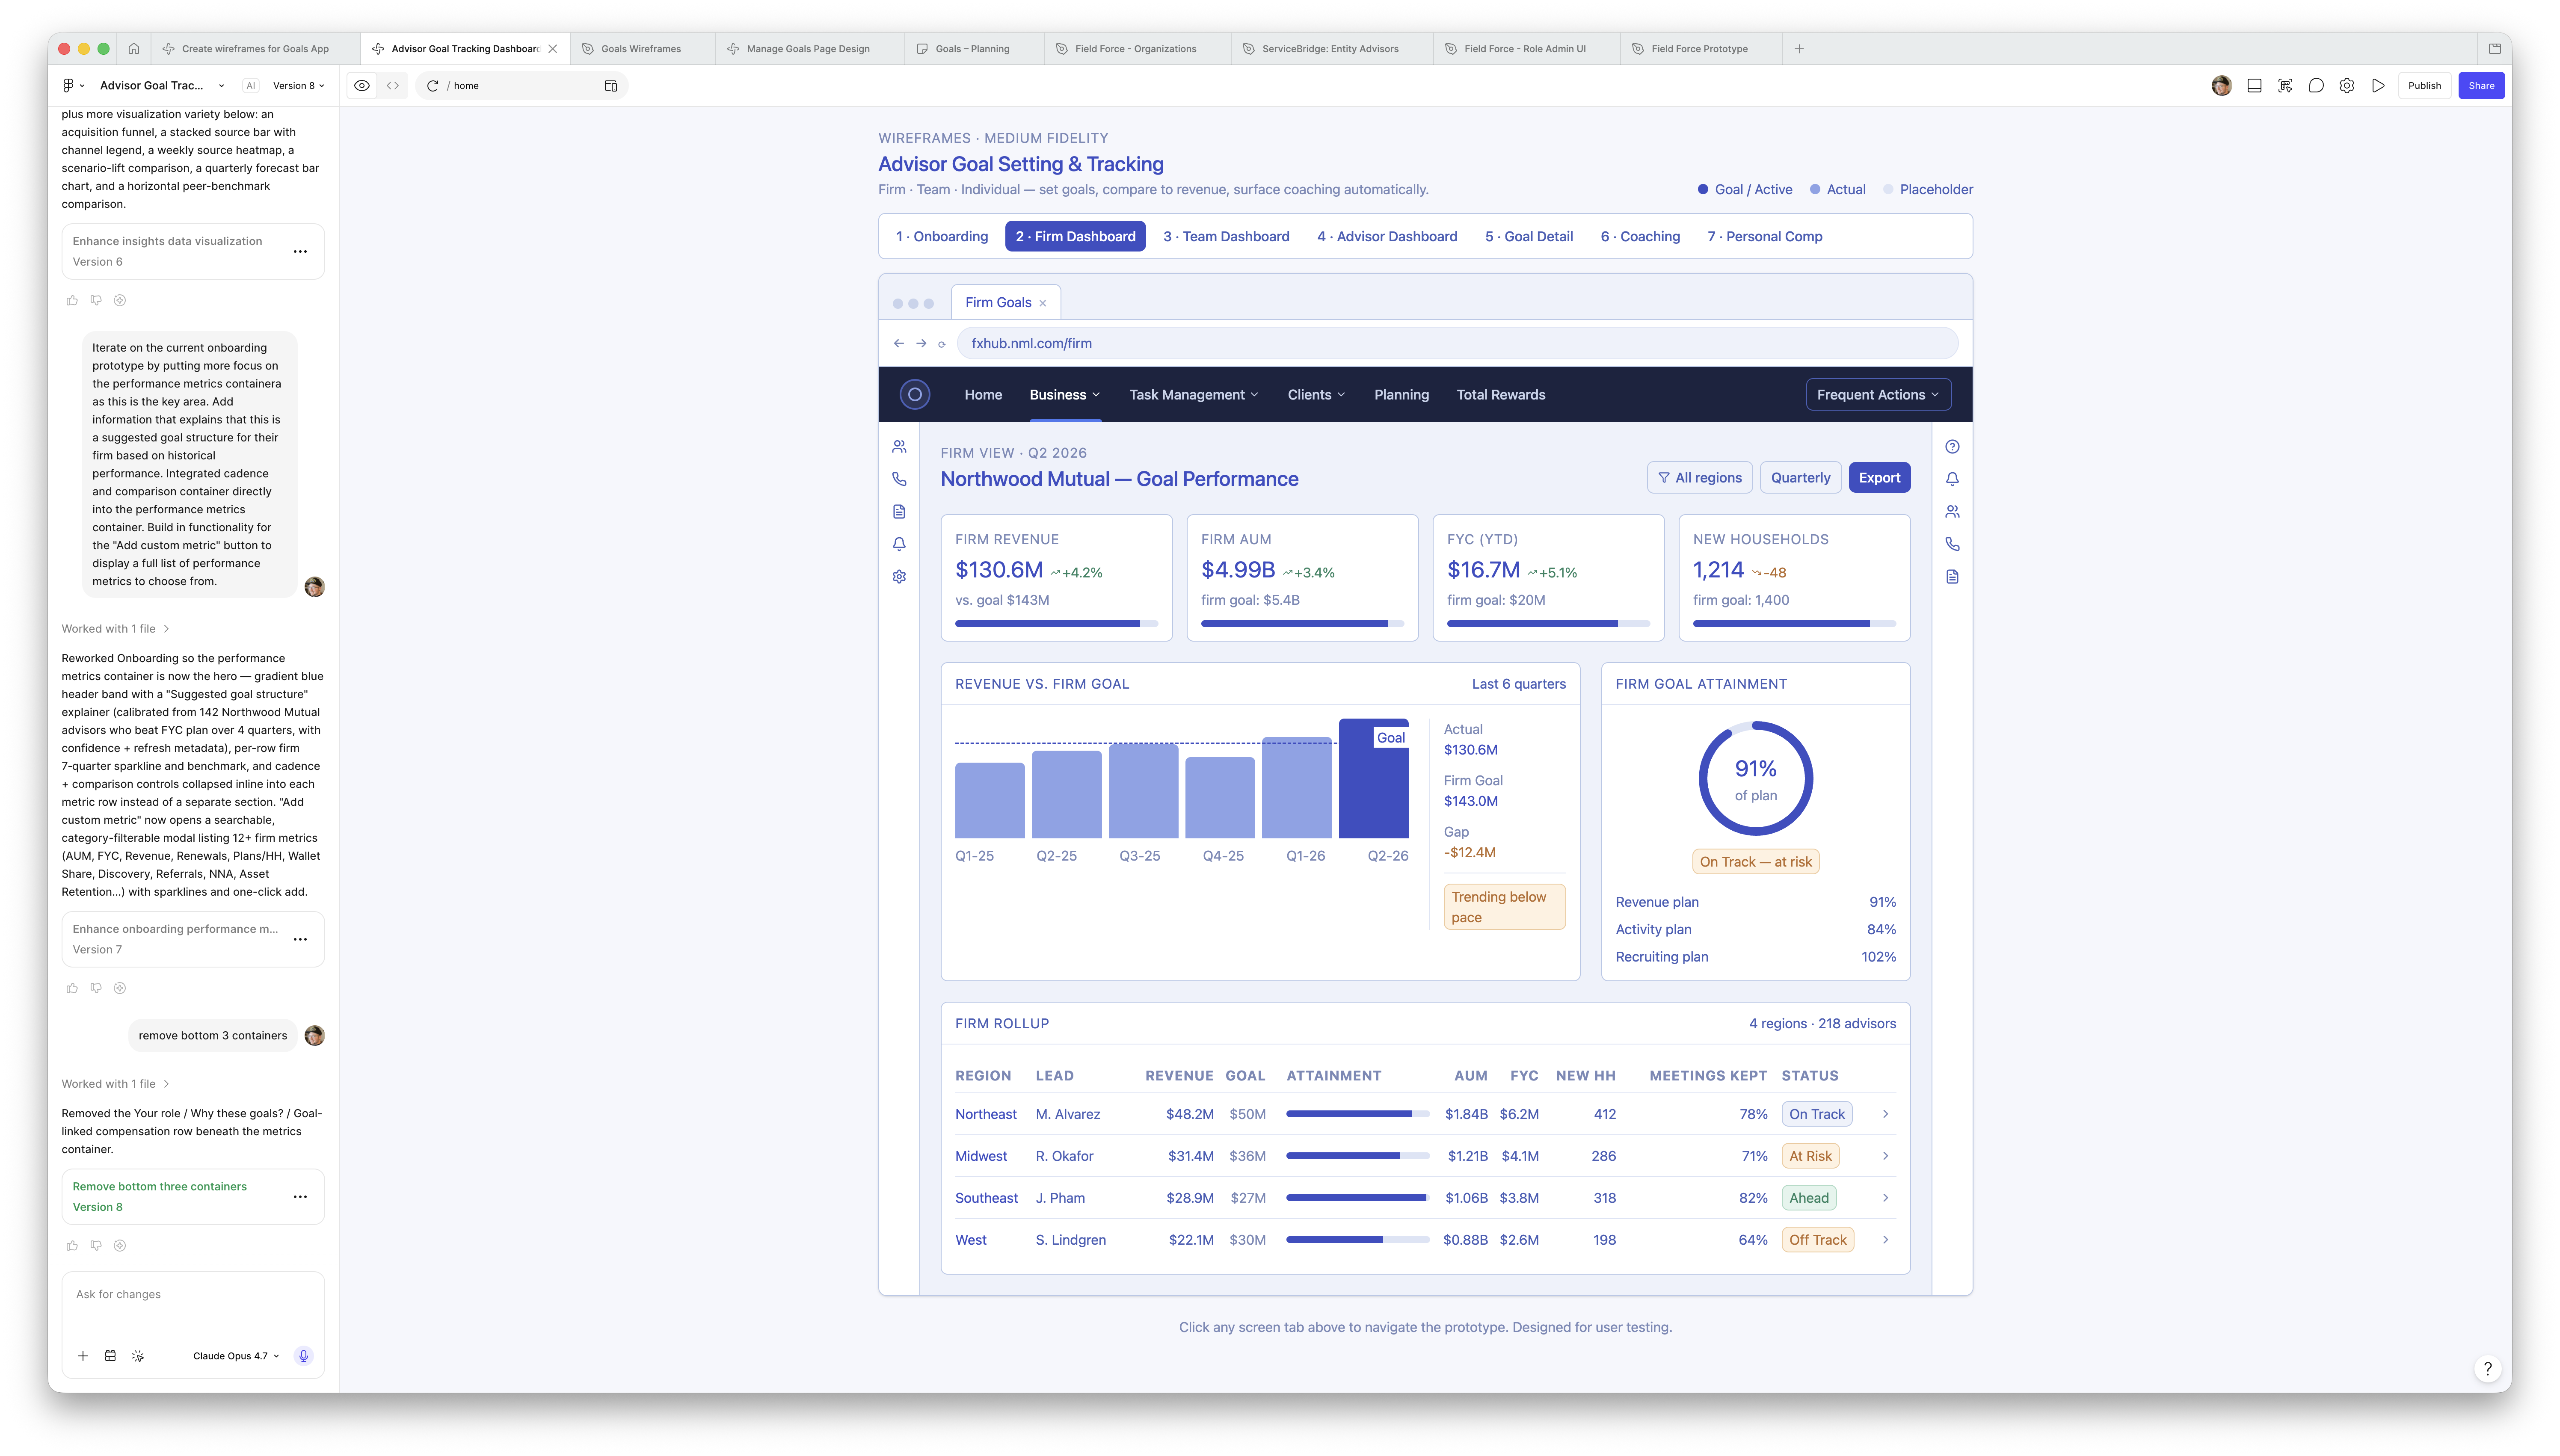
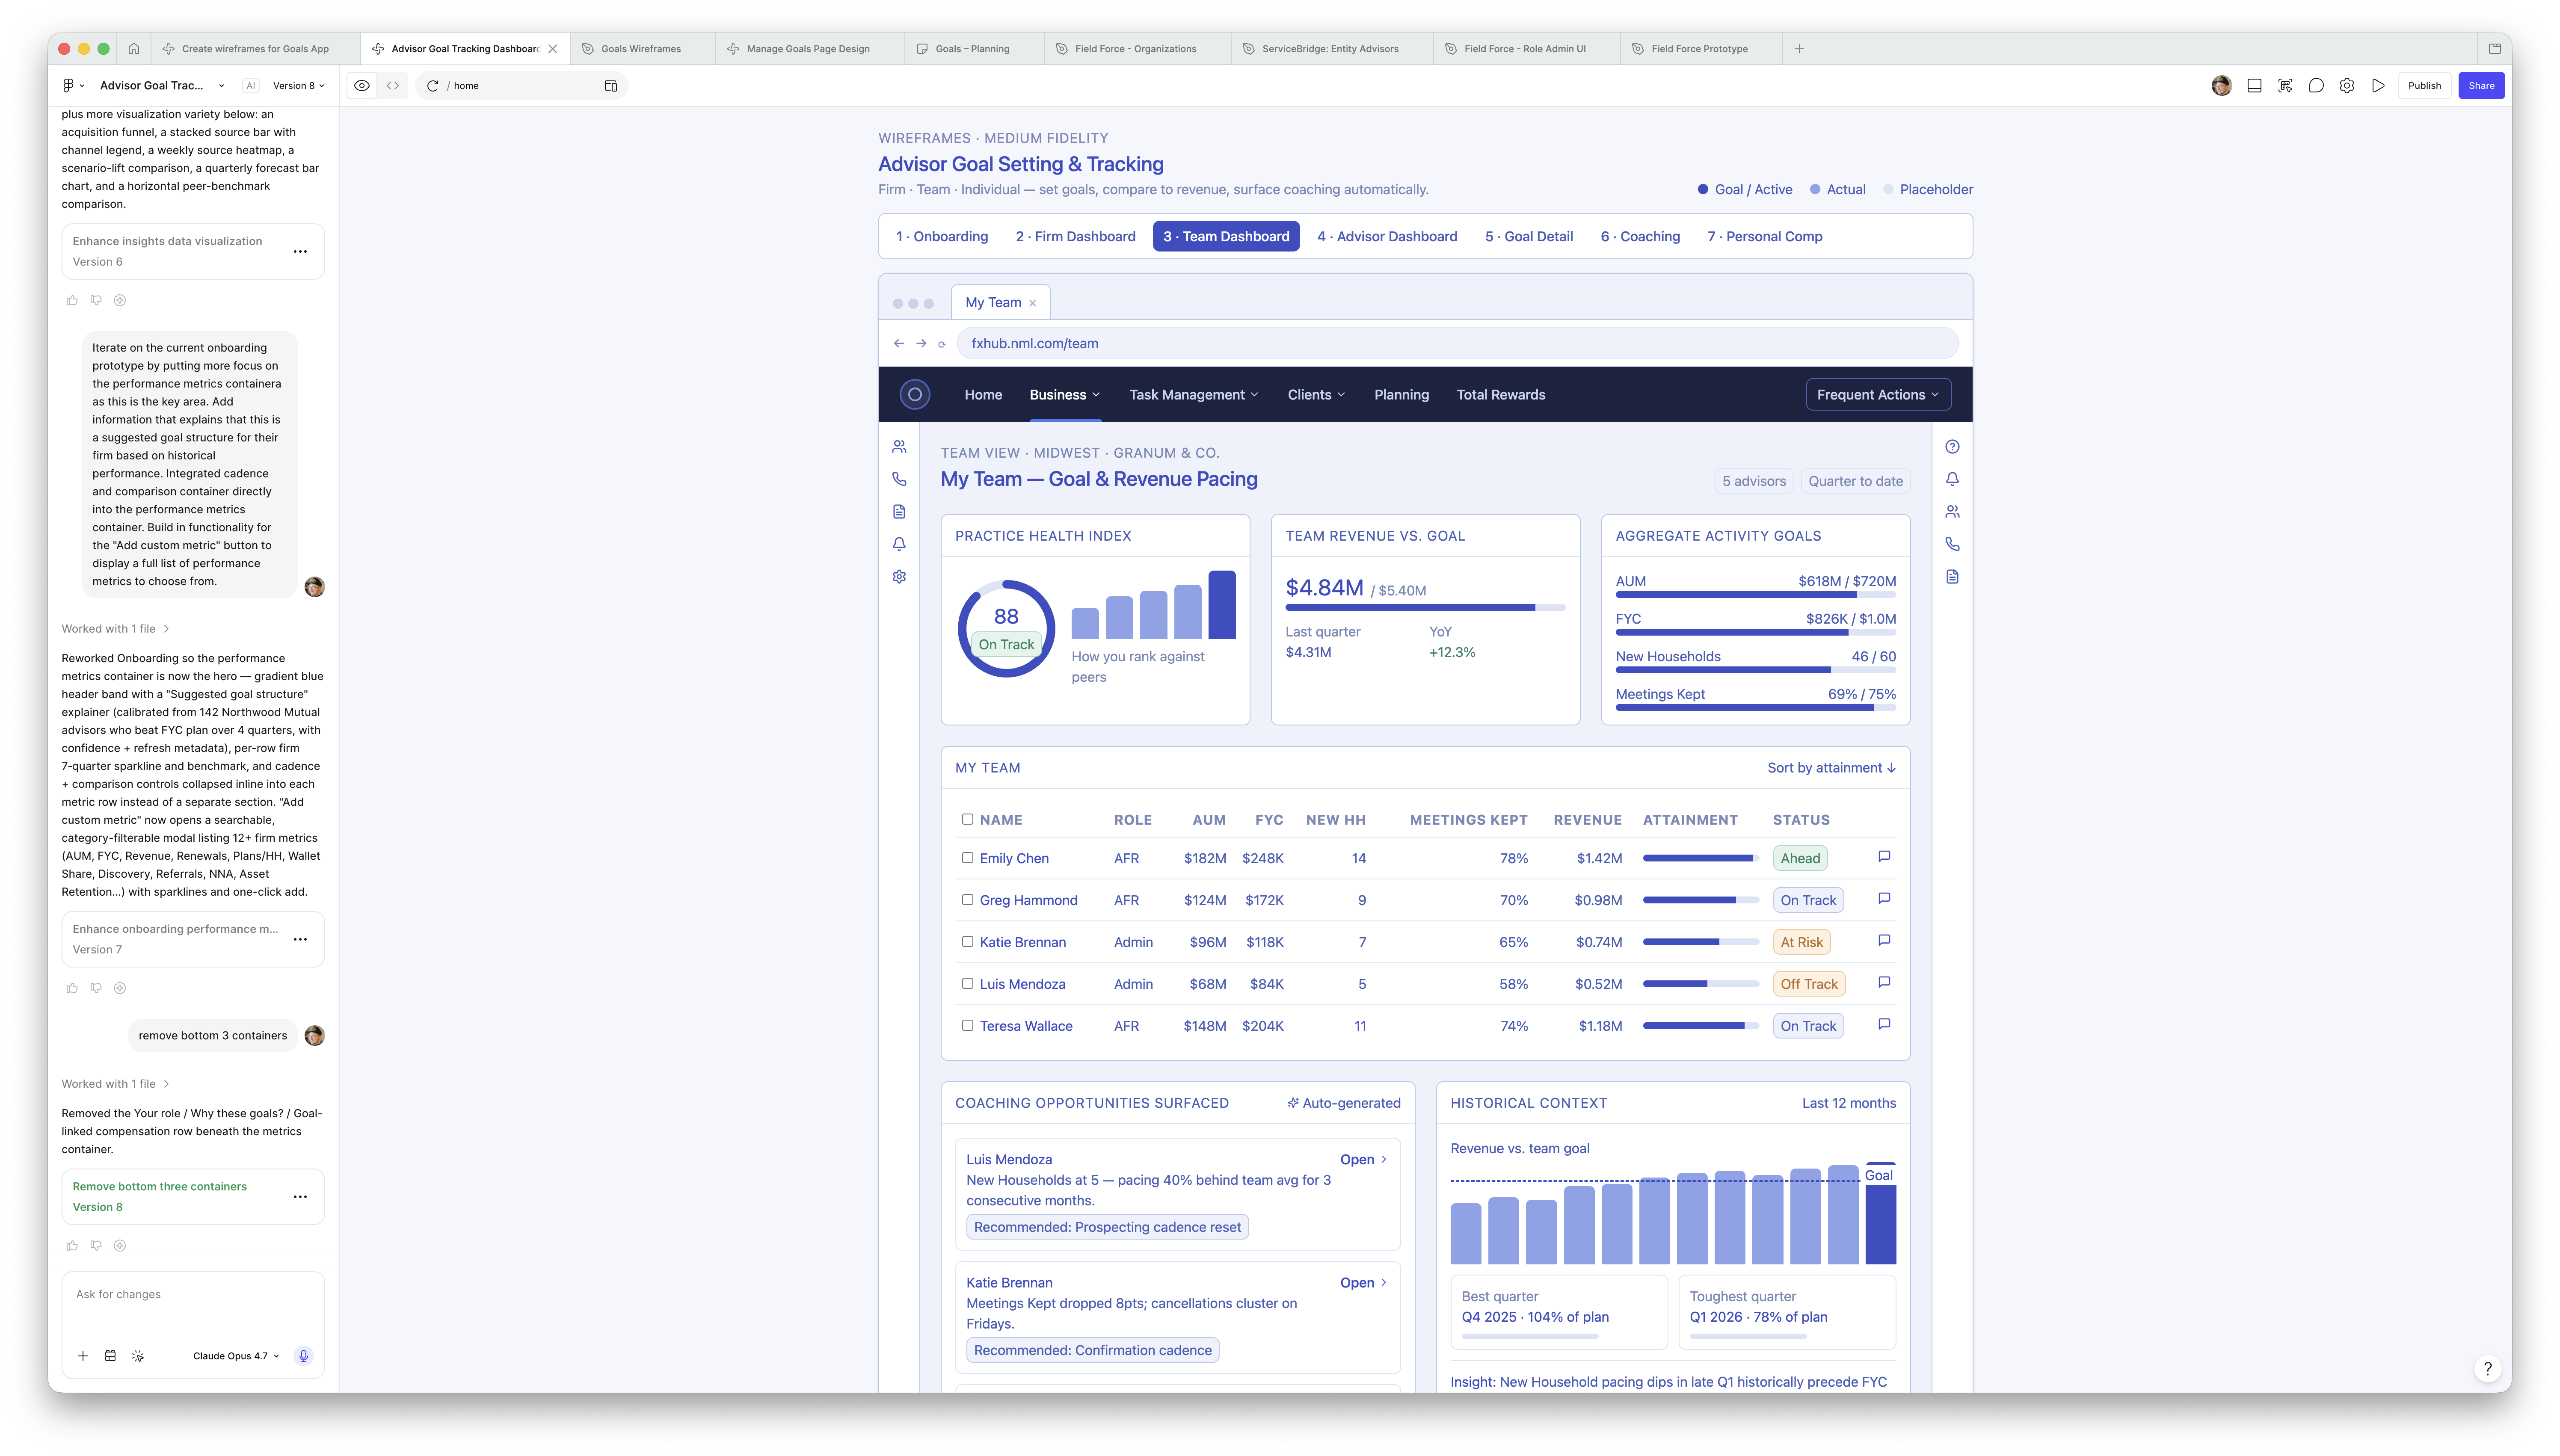
The timeline from research synthesis to testable prototype was extremely compressed. The traditional design thinking process — Understand, Define, Sketch, Prototype — was preserved in sequence, but AI tools collapsed the time between each phase. Copilot turned hours of interview recordings into structured insights the same day sessions closed. Claude helped sharpen the strategy behind them. Figma Make converted those insights into reviewable wireframes within hours. From there, I moved directly into VS Code to build a working coded prototype — a React app running on real data structures and component logic — rather than hand off static mockups. The result was a research-ready prototype in a fraction of the time, without skipping any of the thinking that makes the process meaningful.
Concept
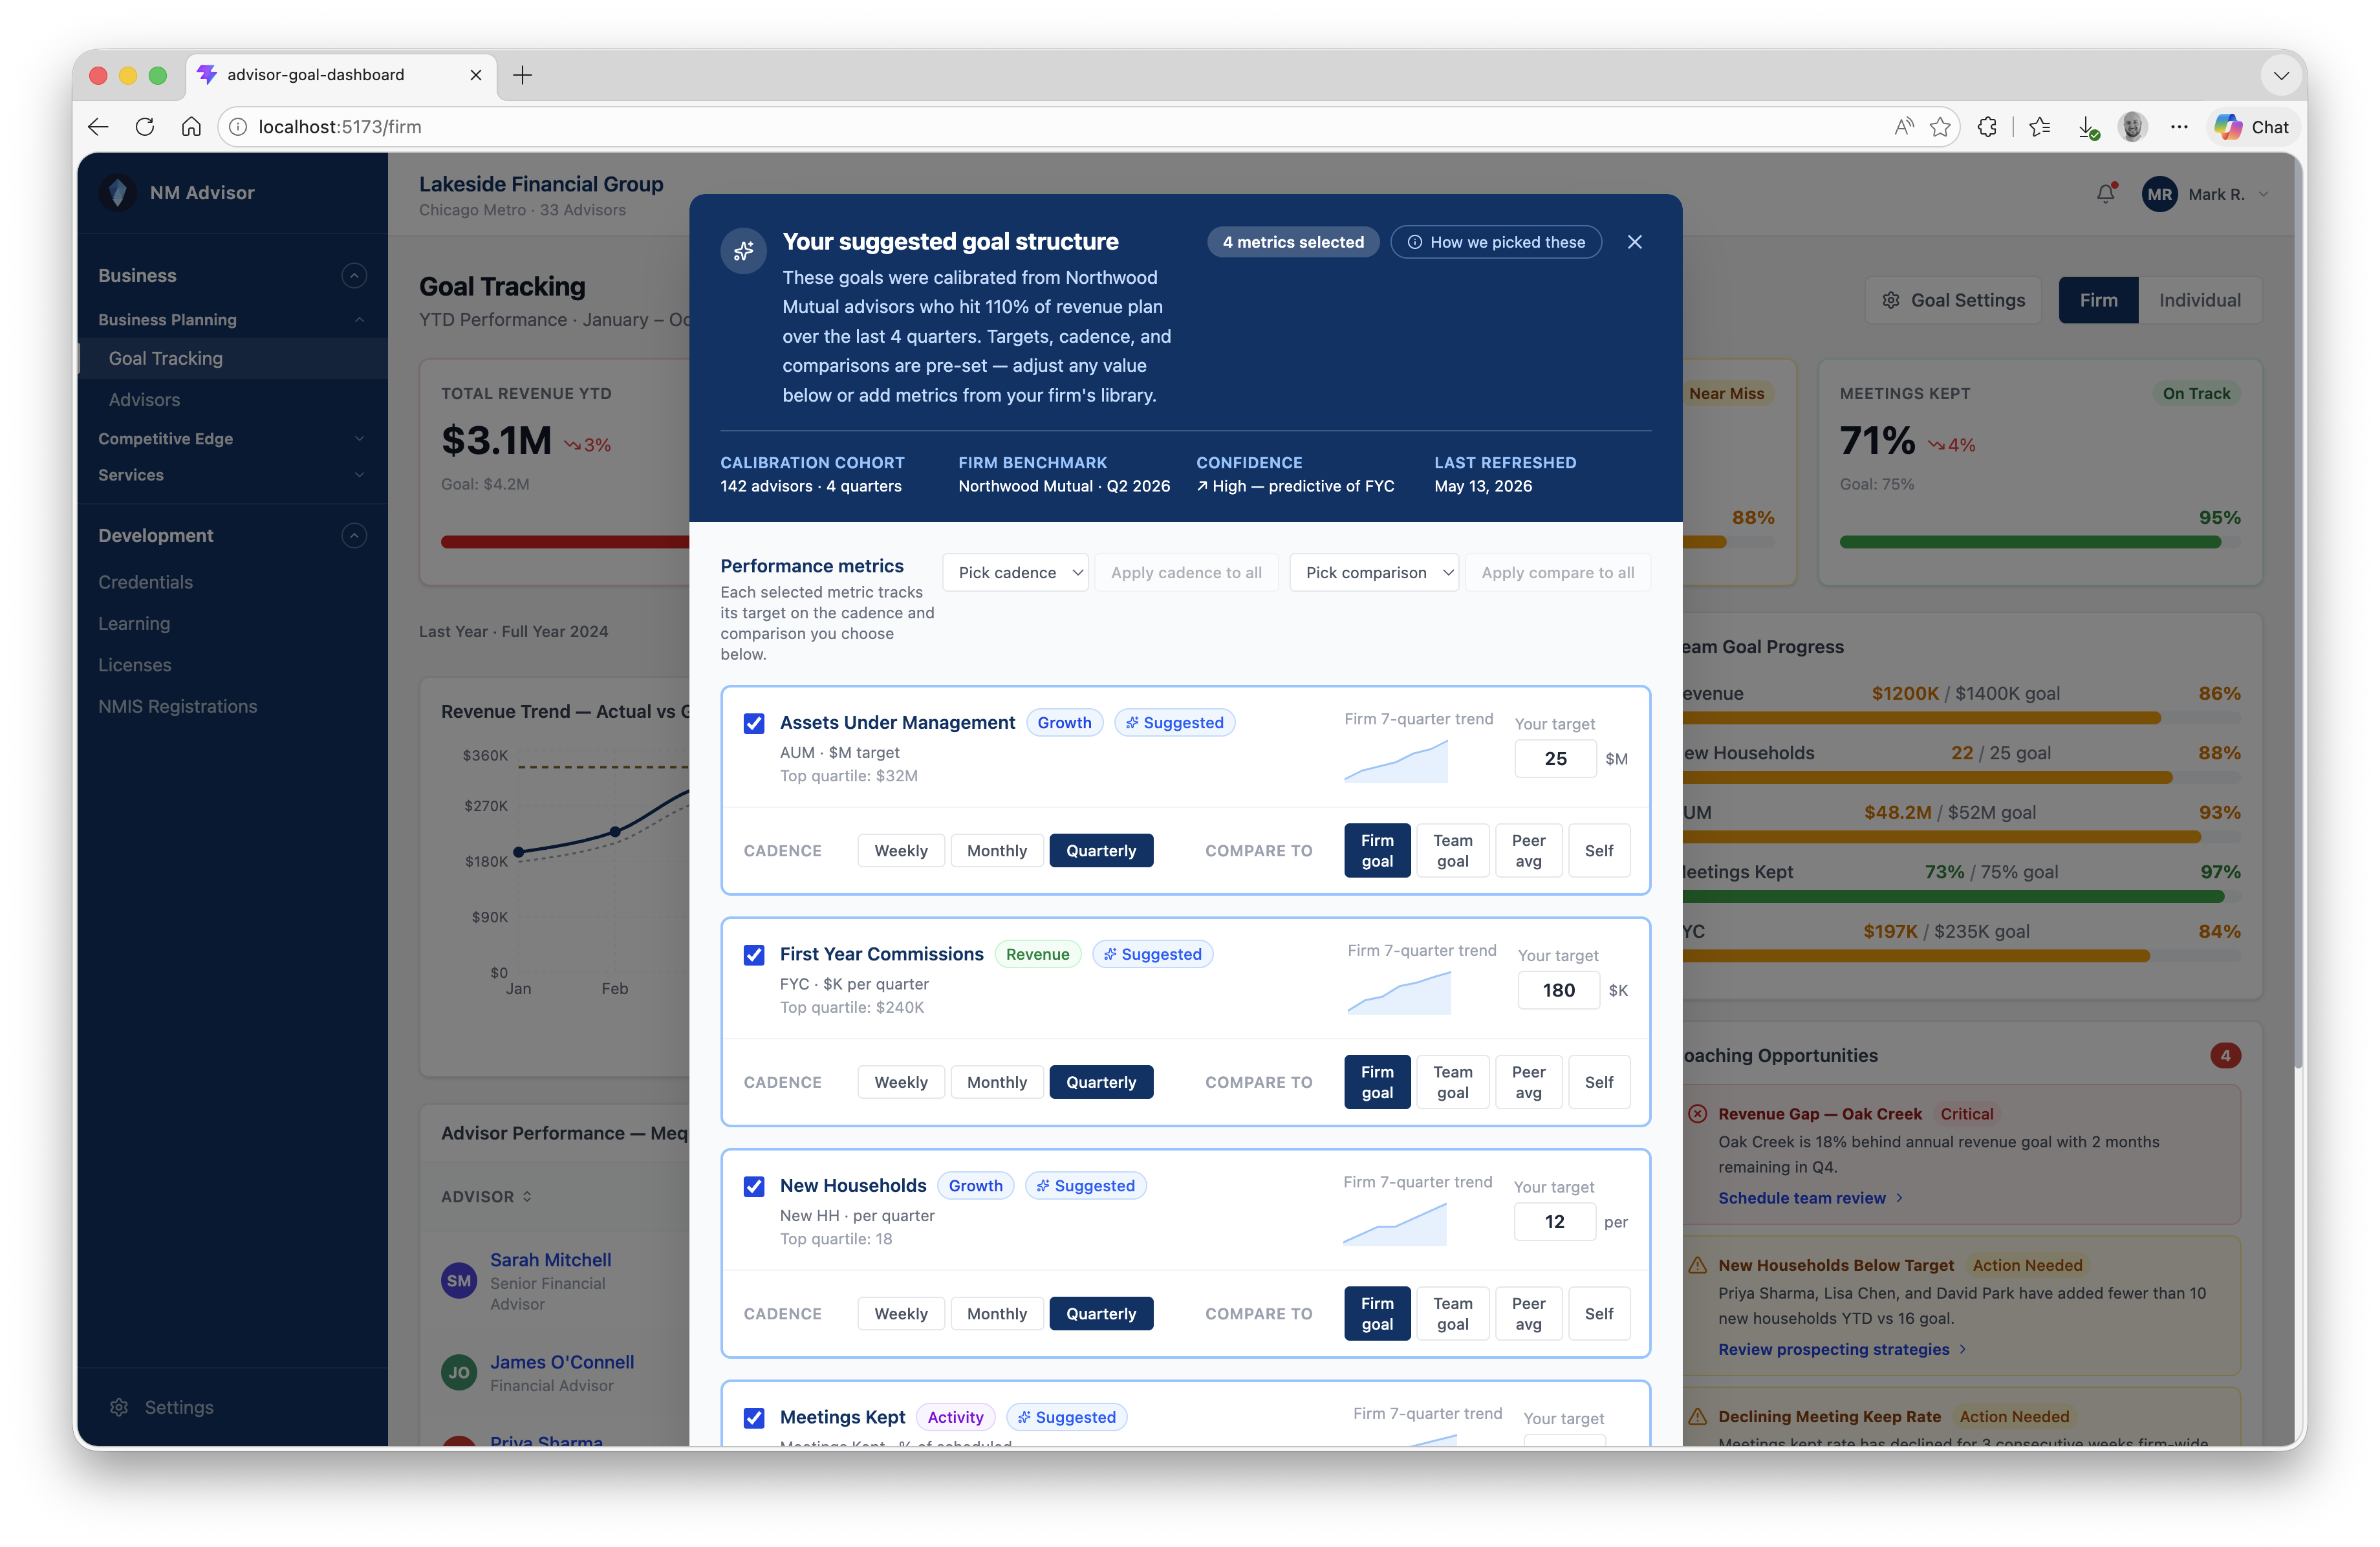
The concepts turn goal tracking from a static report into a living performance system. Onboarding proposes a suggested goal structure calibrated from advisors who outperformed plan — pre-set targets, cadence, and comparisons the firm can adjust or extend from its own metric library.
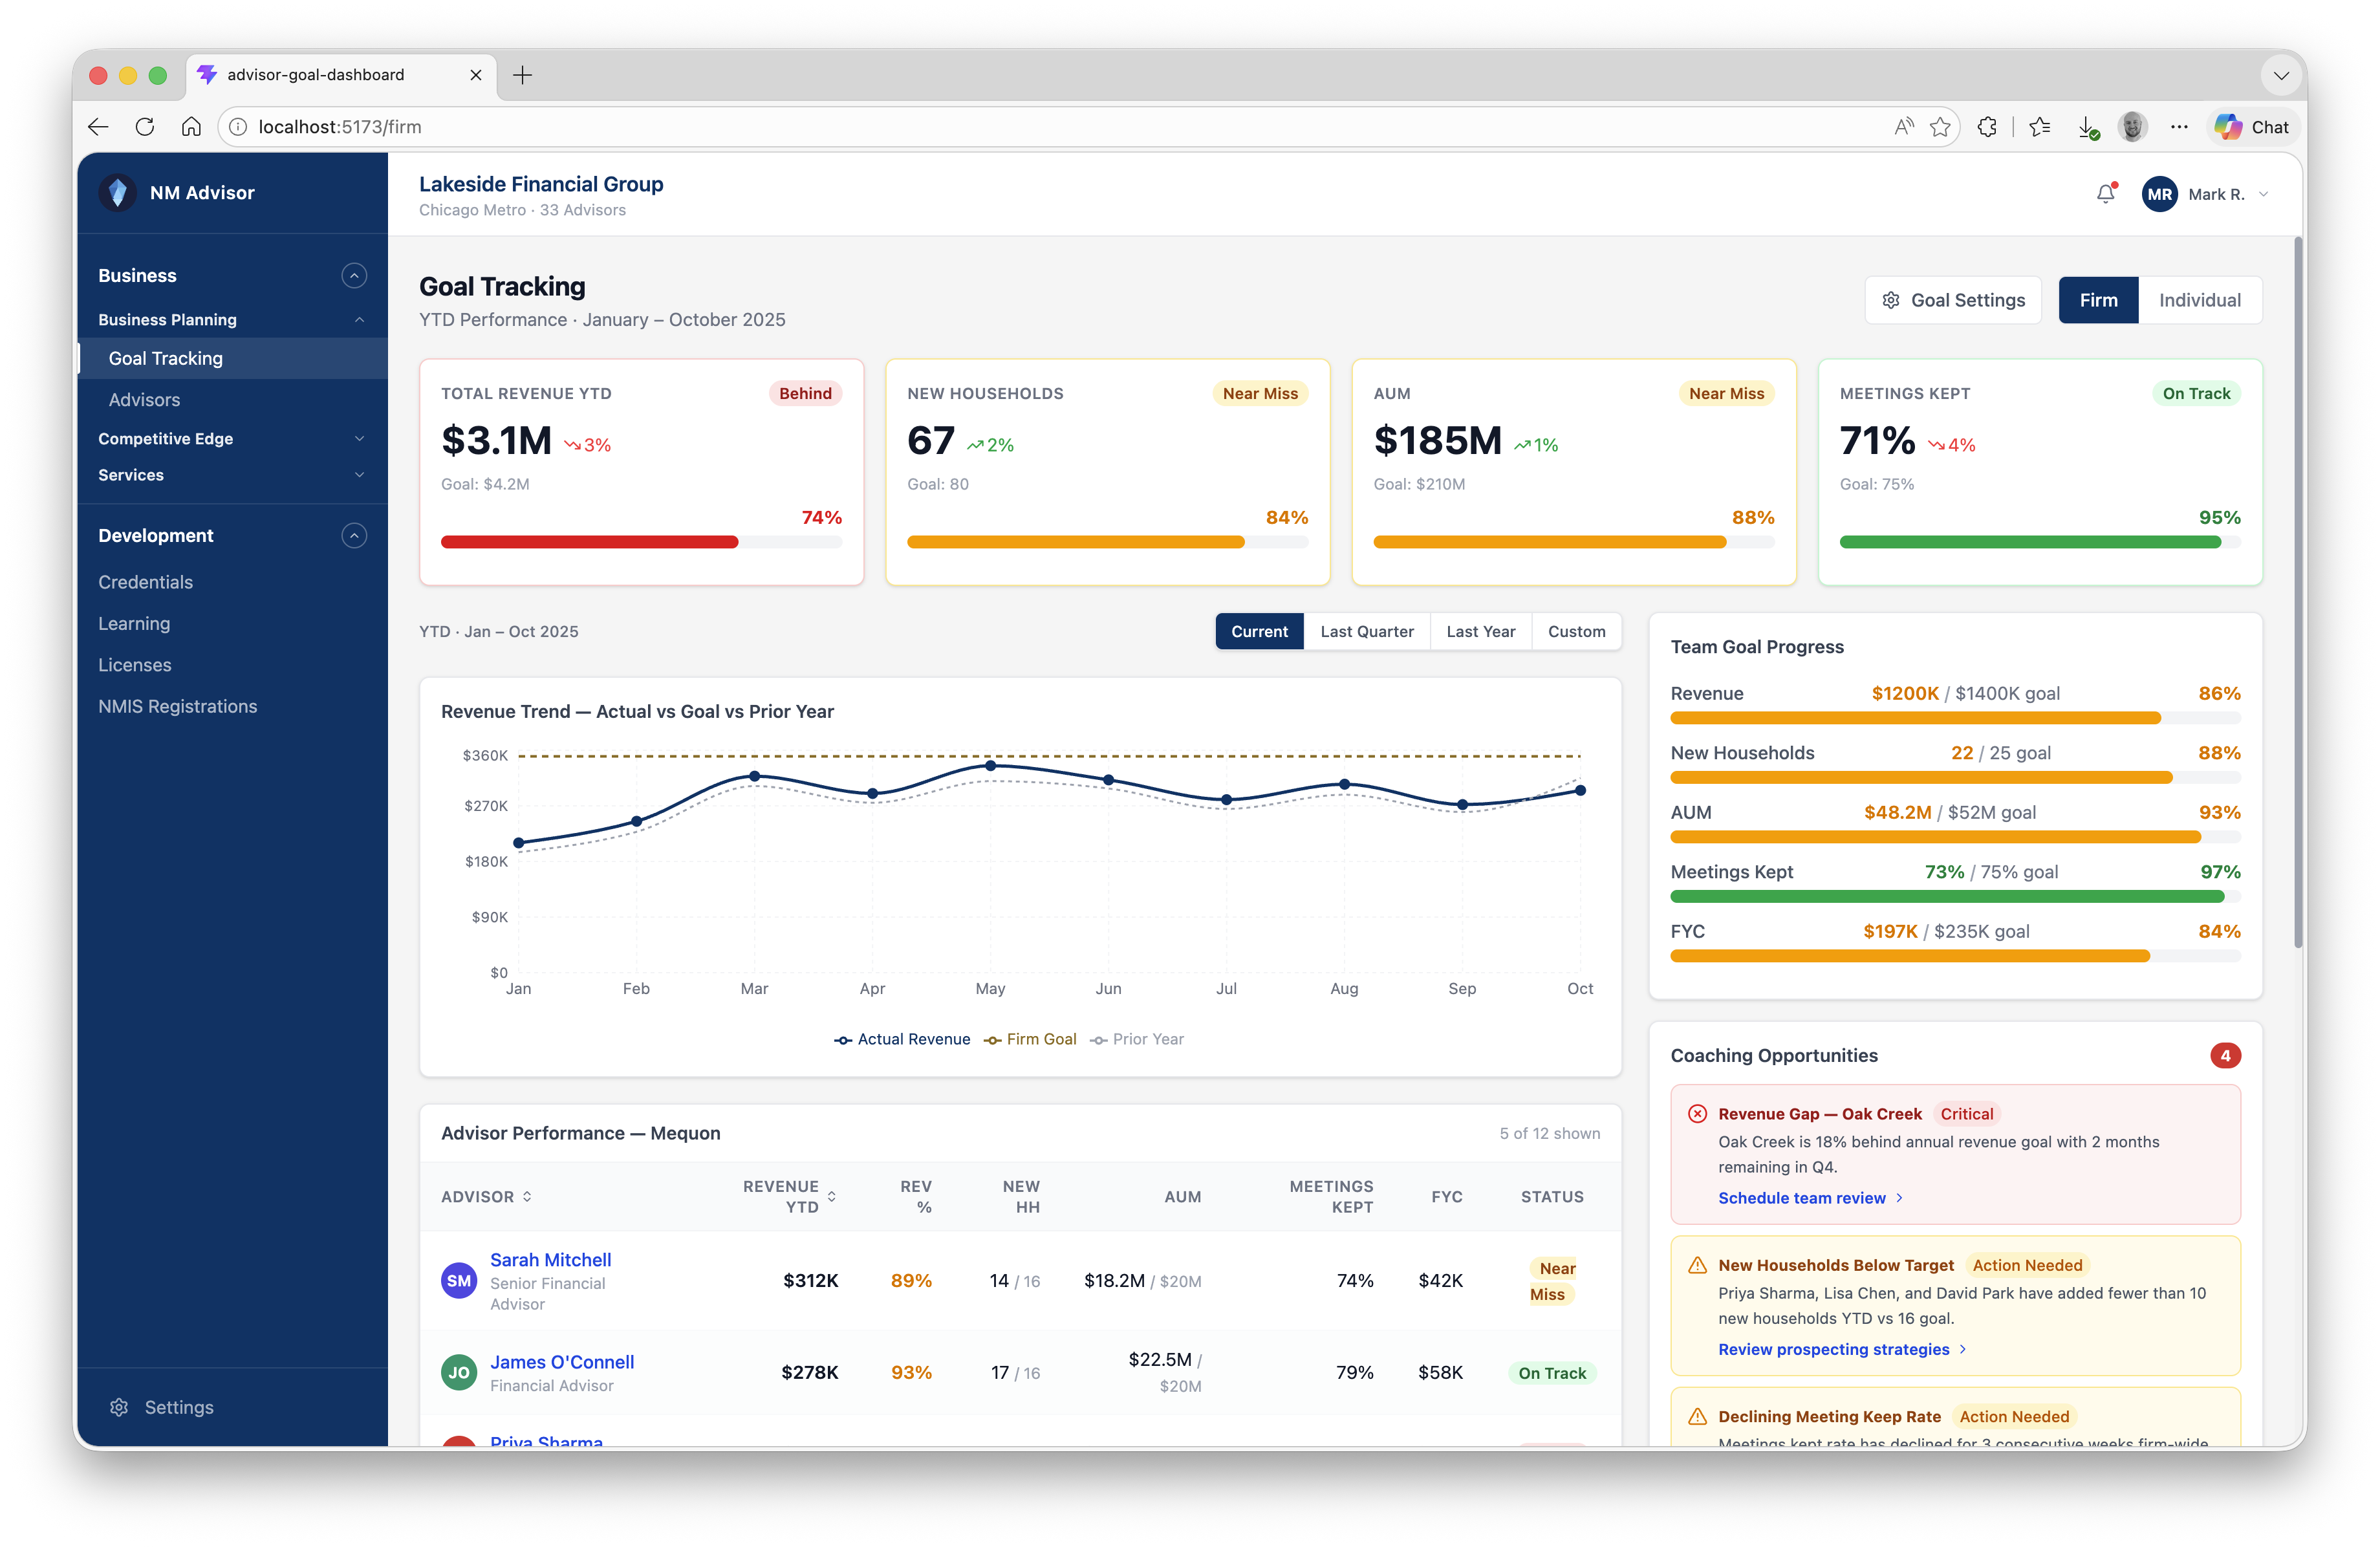
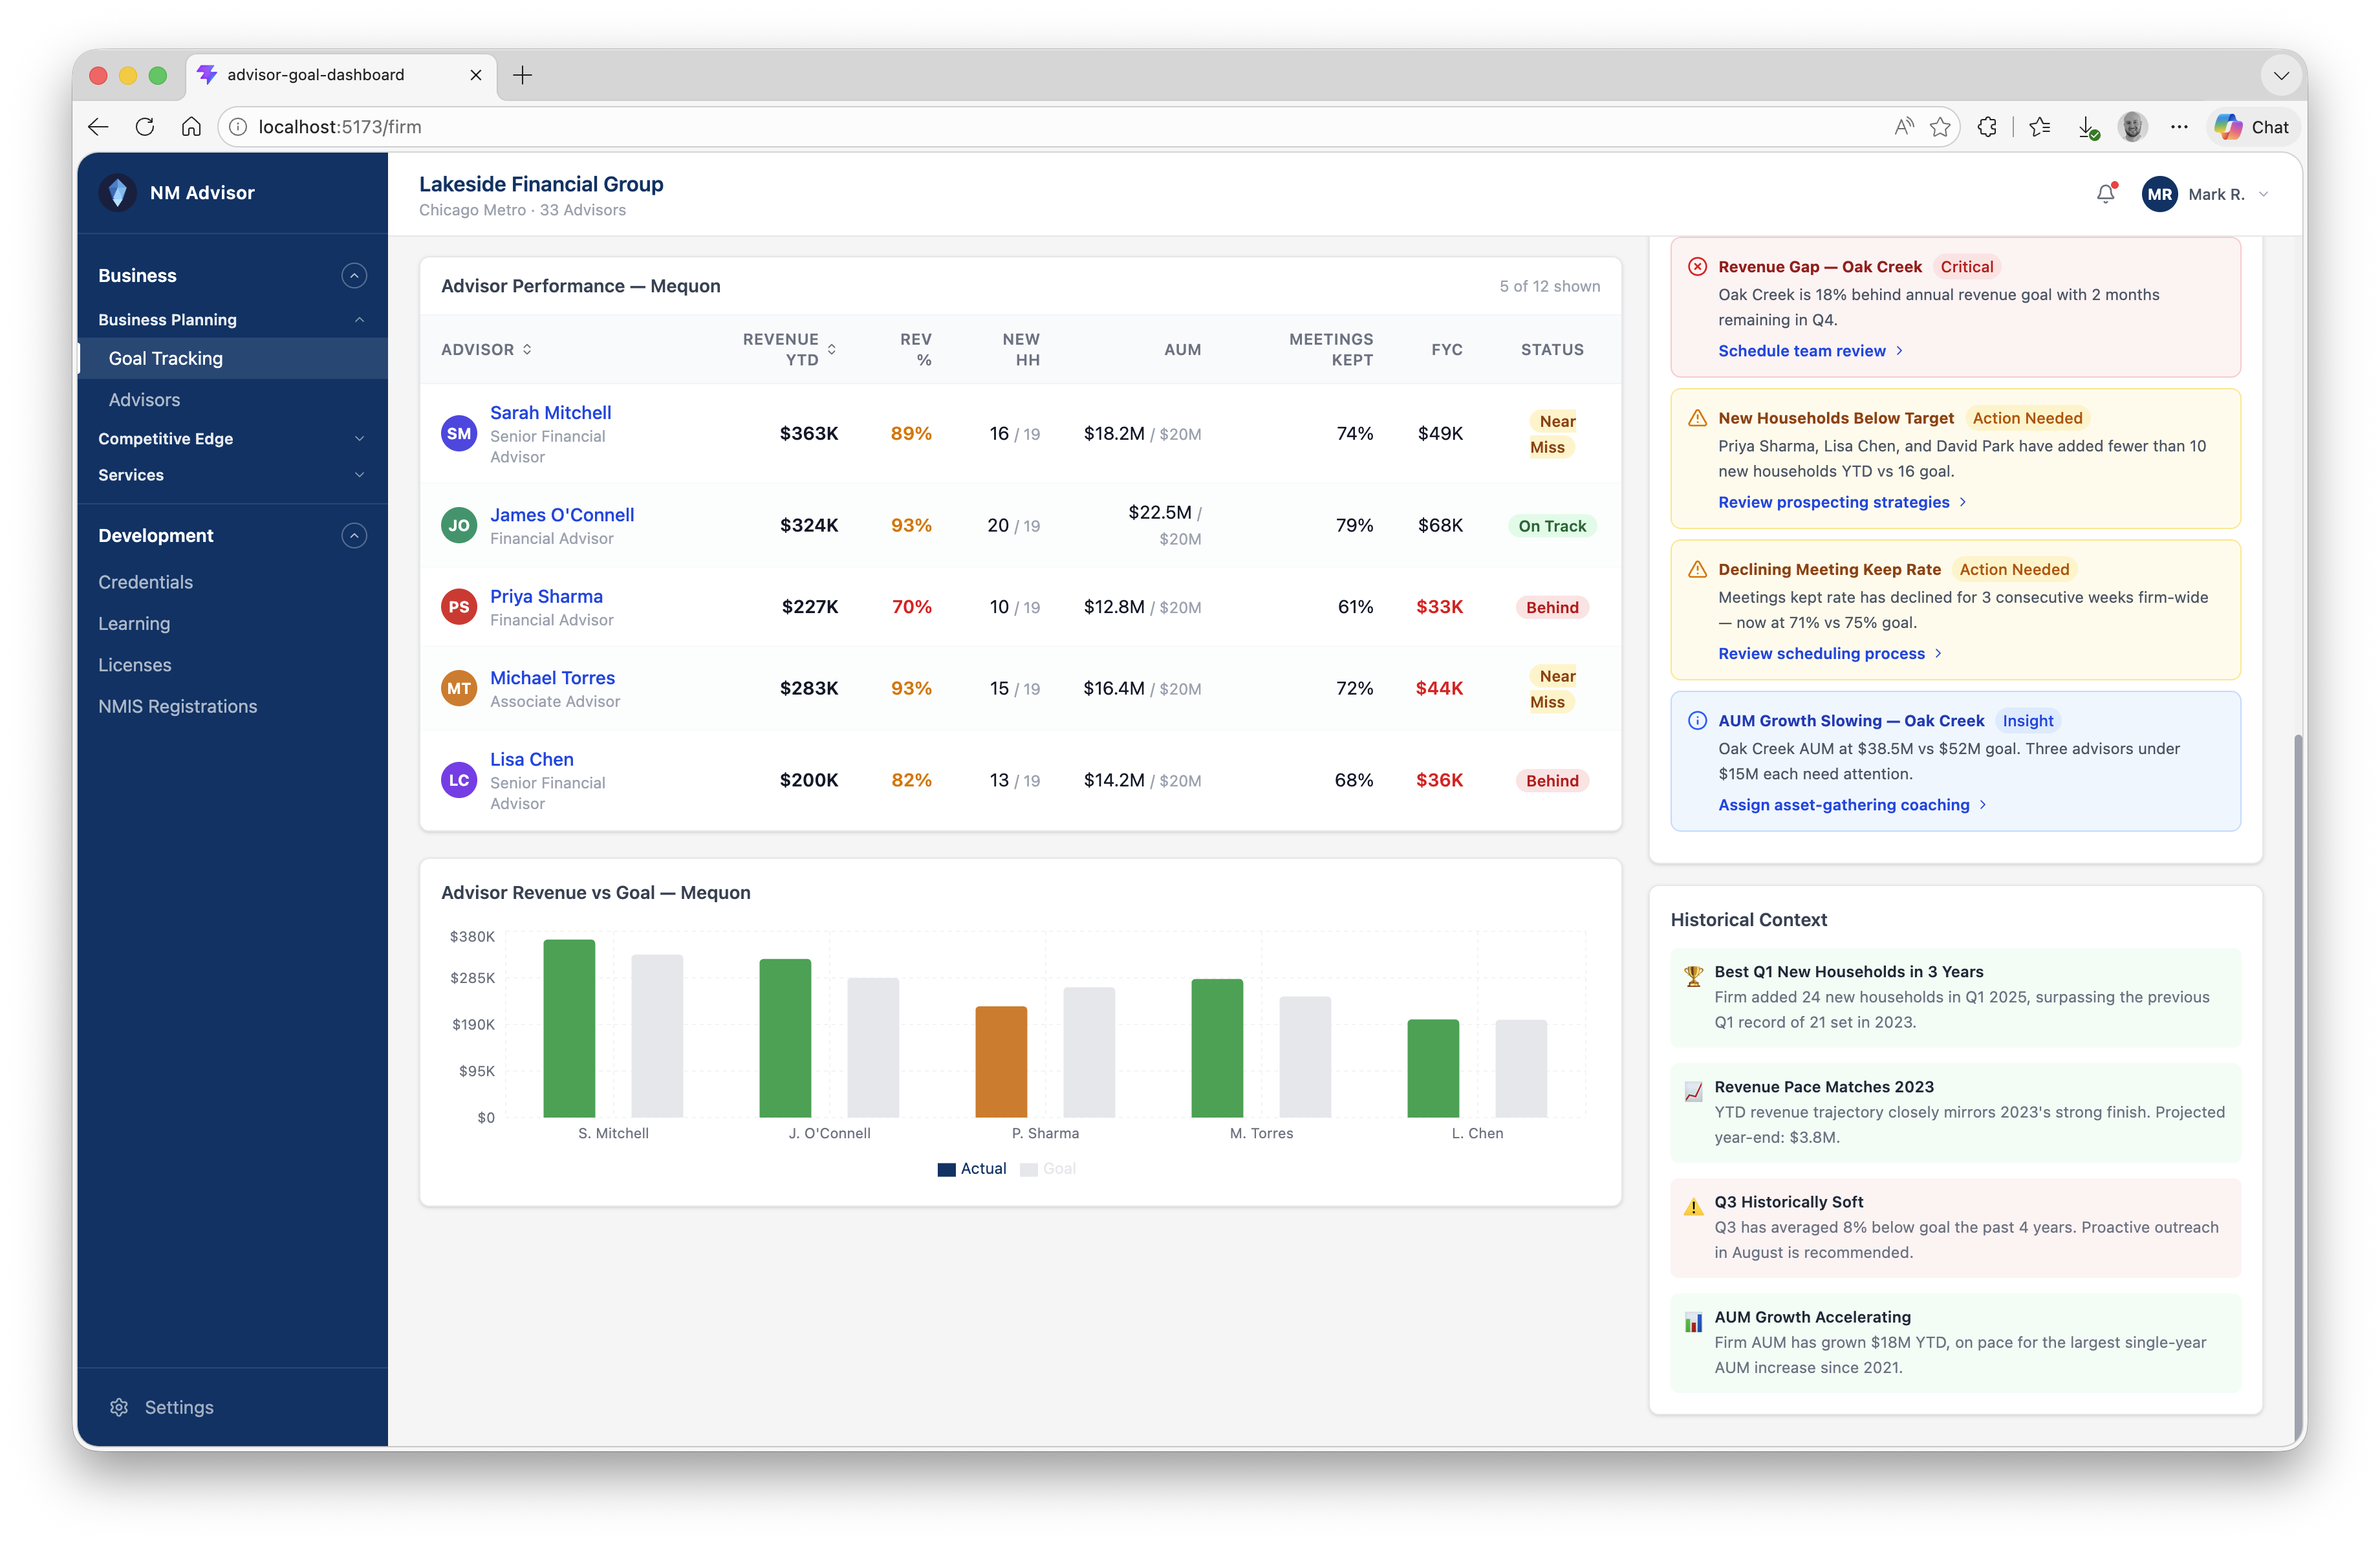
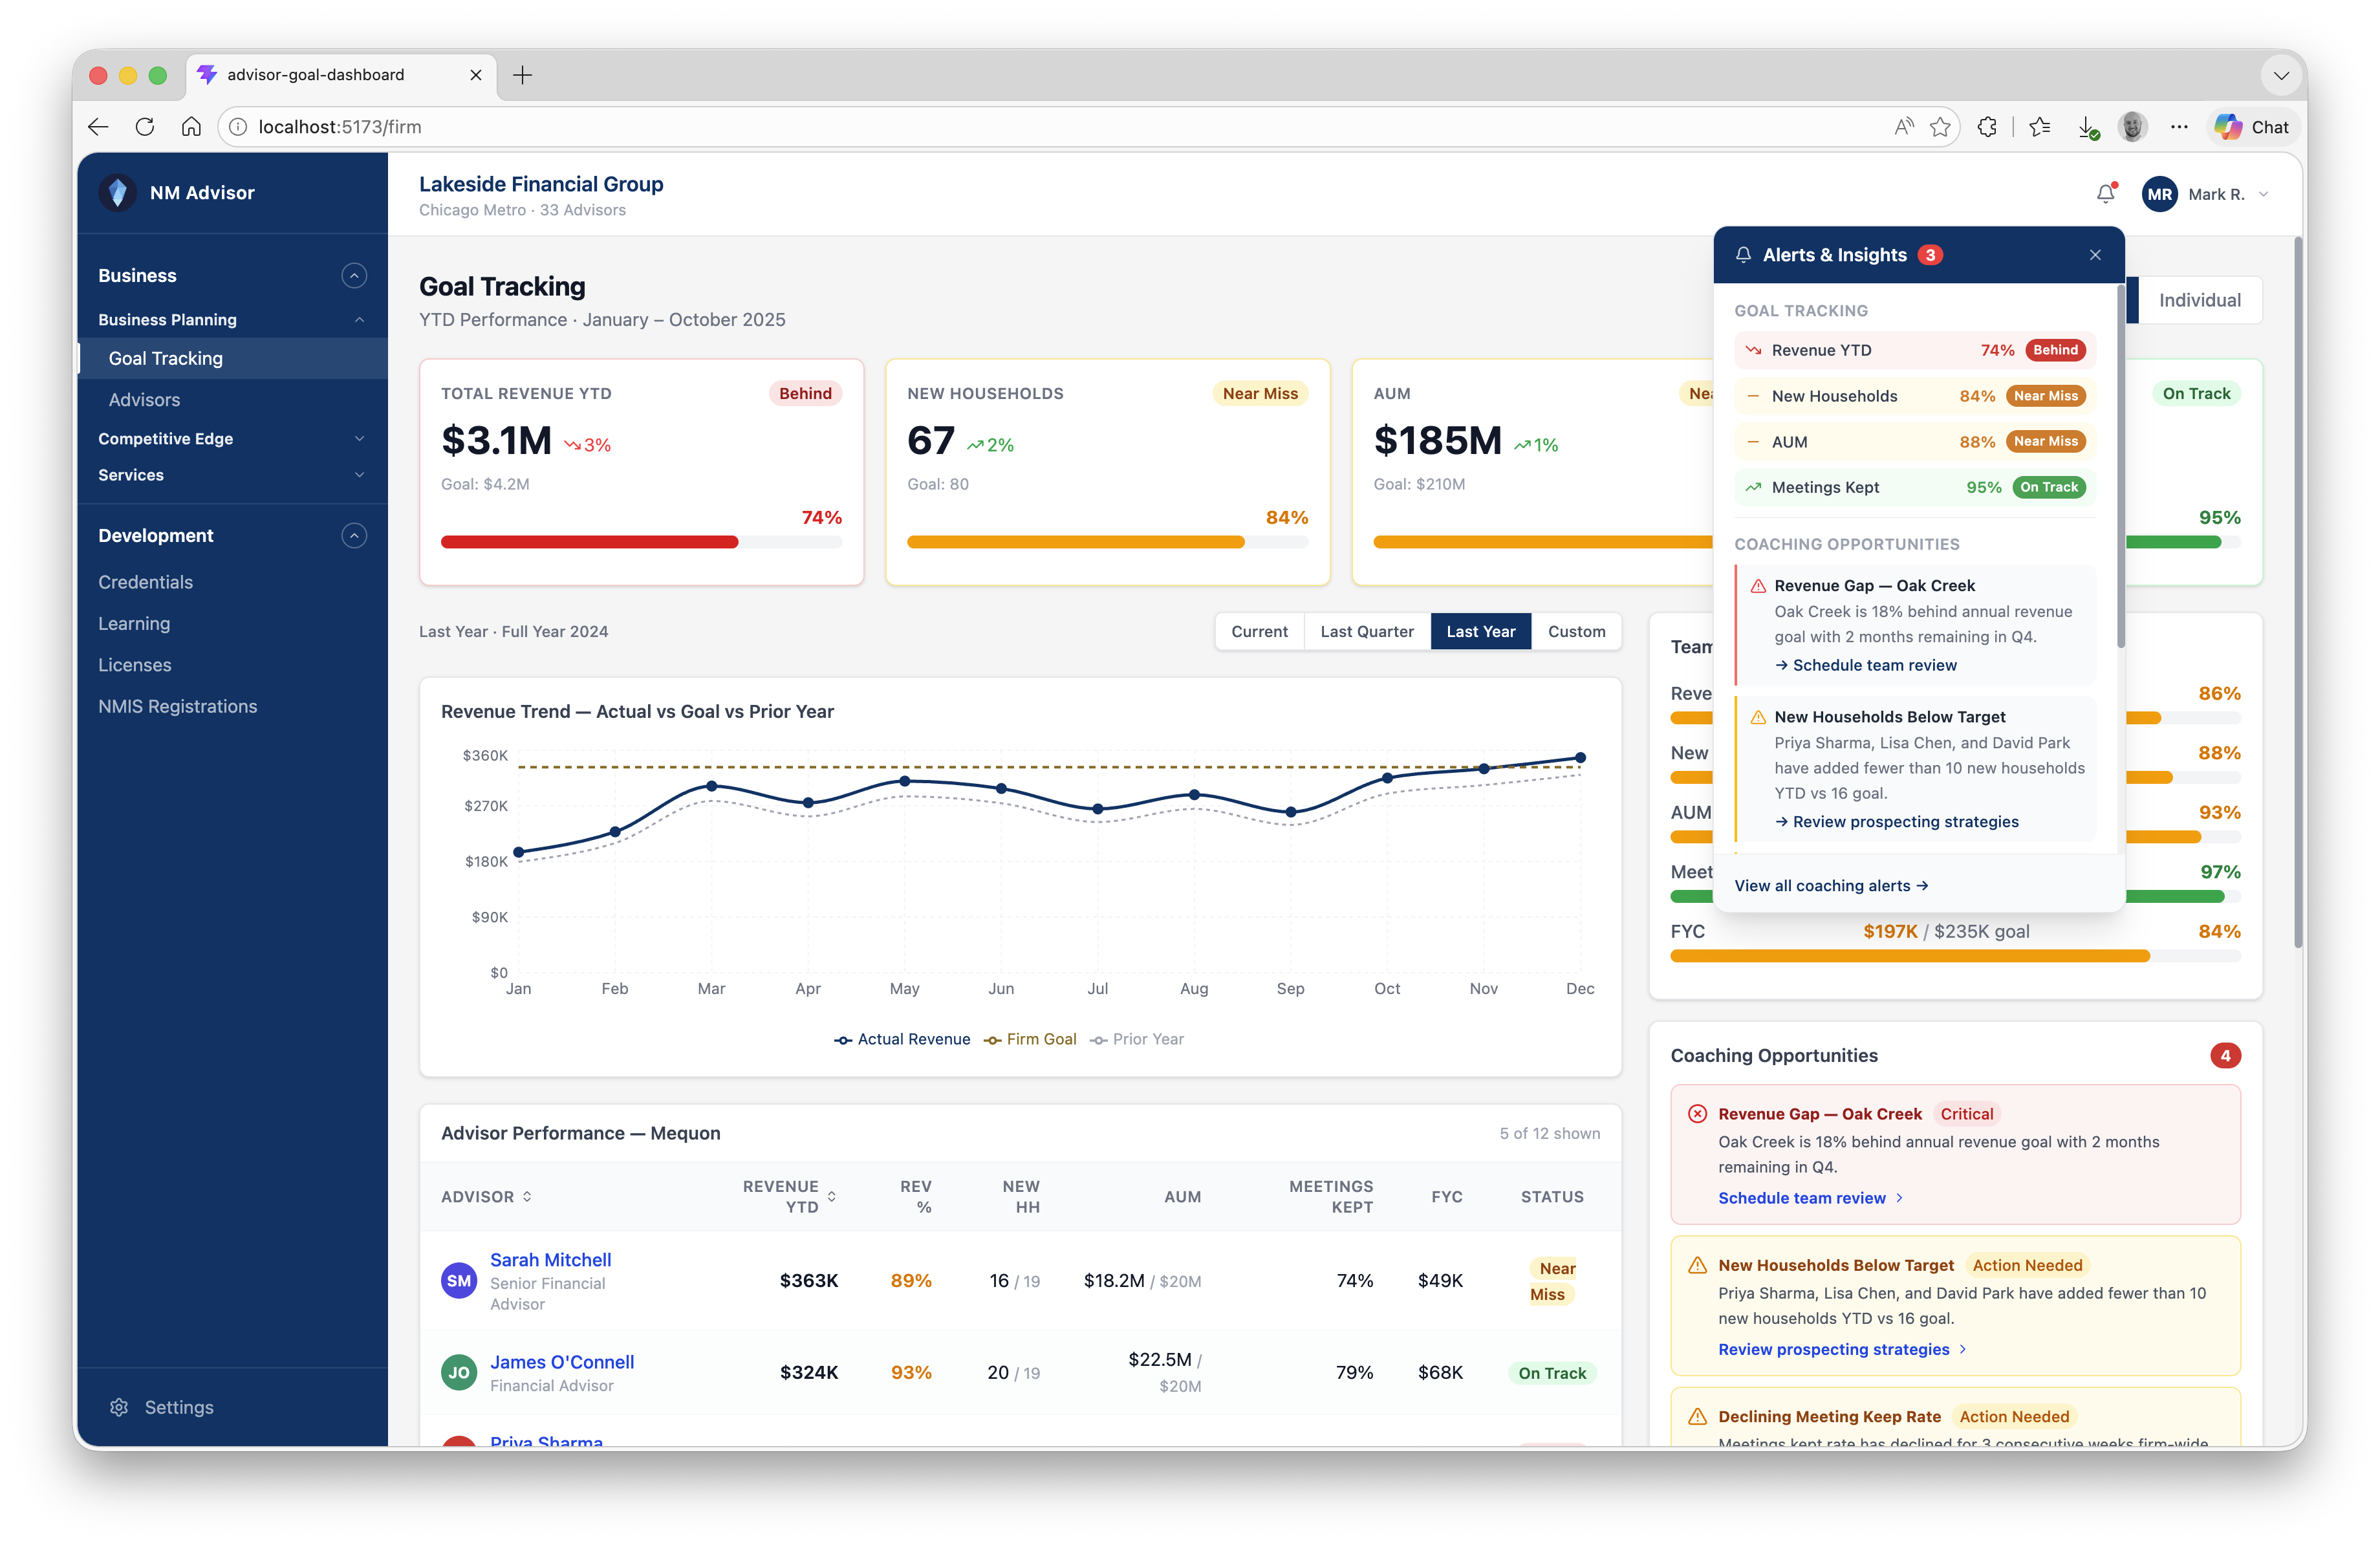
Firm and team dashboards show progress against goals with clear status (on track, near miss, behind), revenue-vs-goal trends against prior year, and coaching opportunities surfaced automatically where performance is slipping.
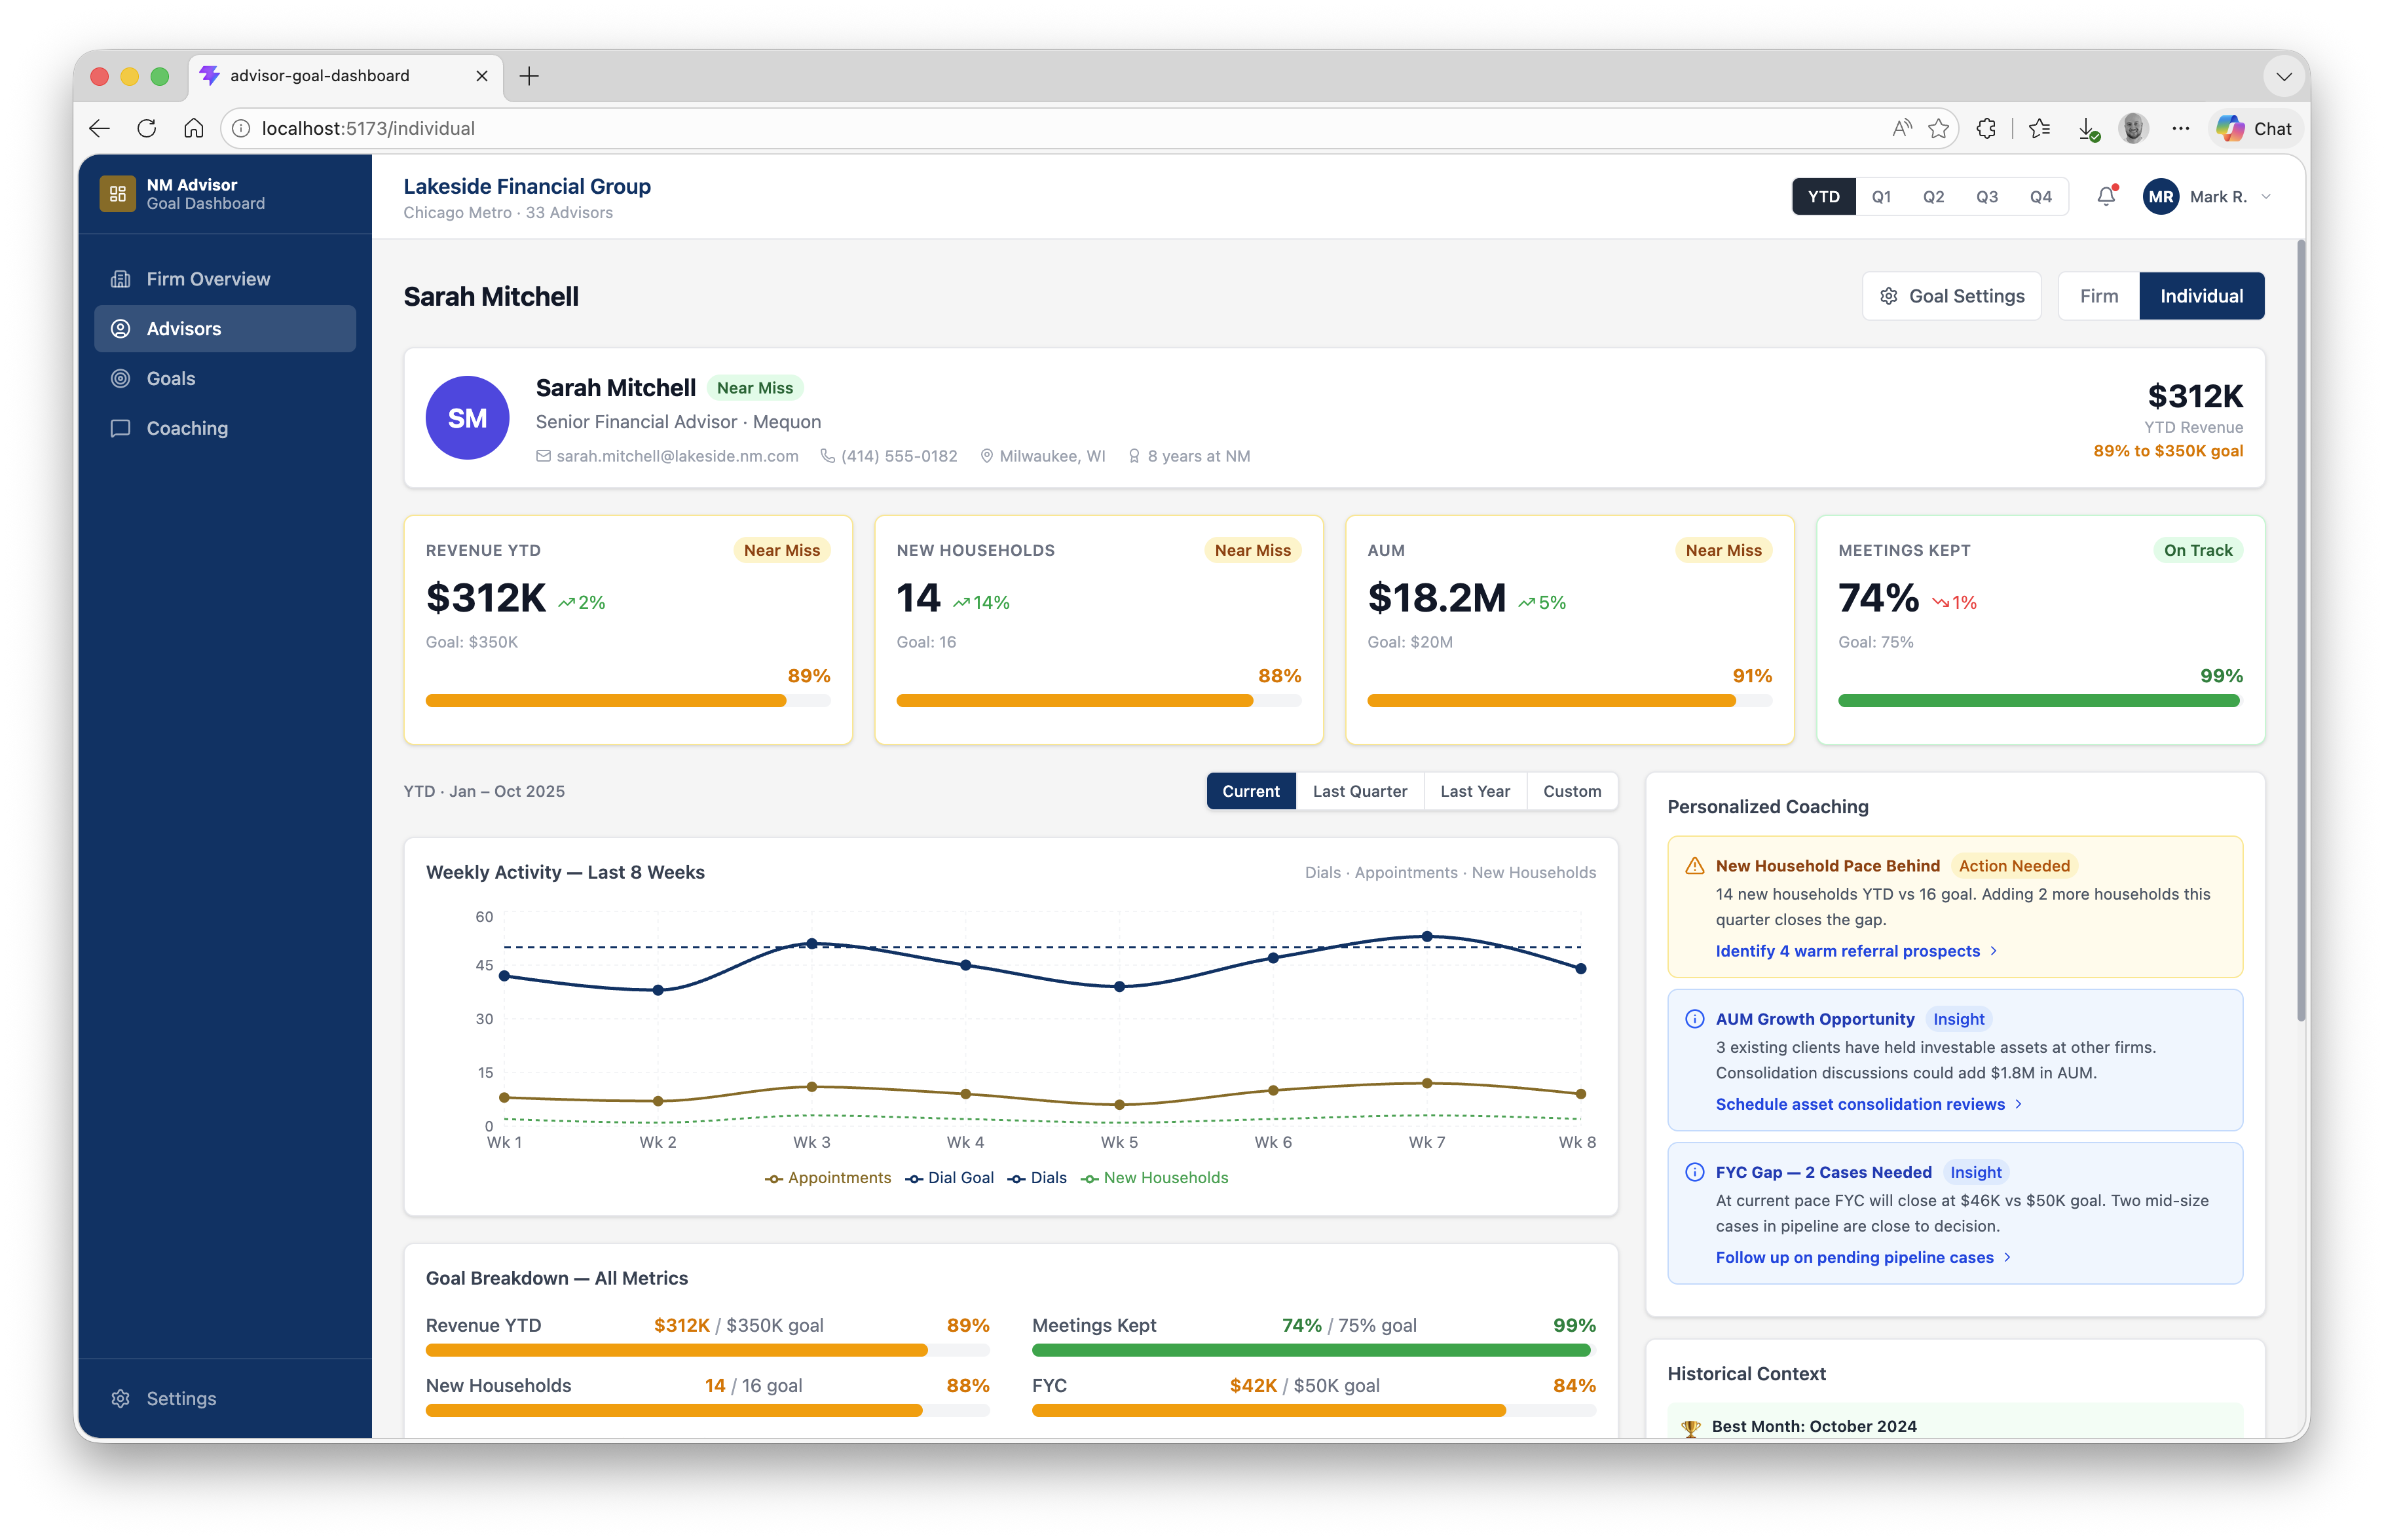
The individual view connects the dots the old tools couldn’t — weekly activity, household growth, and revenue pacing in one place, with personalized coaching tied to specific gaps.
Alerts and insights pull at-risk metrics and coaching prompts to the surface so leaders see them in the moment rather than at quarter-end.
What’s next
The coded prototype is being used as the stimulus for moderated UXR sessions with operations leaders (COOs, CFOs) at top large firms — pressure-testing the concepts against real mental models and workflows in the same environment advisors would use it. Research findings will refine the requirements for a goals experience that scales to large teams — one that builds trust through accurate attribution, connects activity to outcomes, and surfaces problems early enough to act on them.